Mastering Data Analysis Tools
One of the main tasks required by a CFD researcher is to understanding the embedded analysis tools provided in the software in-order to
Vector Plots
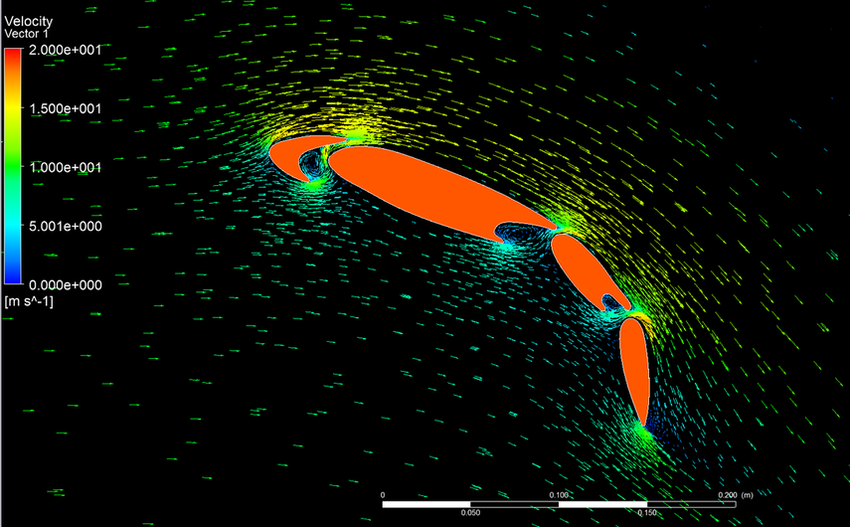
Vector plots are used to specify the direction of the flow, usually the first thing to check after a simulation is run the direction of the flow if it is correct or not.
You can apply vector plots to 2D plans and 3D domains. Need to note that circulations regions can be found once a timed stepped simulation is conducted, then once the subtraction of two time steps is done this reuslts in the visulization of the circulation regions, for a 2D case. Dealing with a 3D case where visualizing of an occurring vector velocity field allows us to capture occurring vortex shedding patterns after metal beam bar. Some times the concentration of vector arrows in a certain region of a studied regions refers to the occurrence of an increasing speed region.
Contour Plots
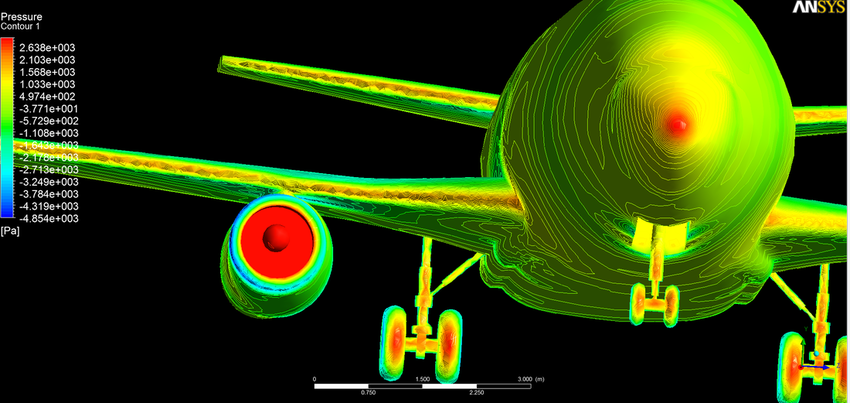
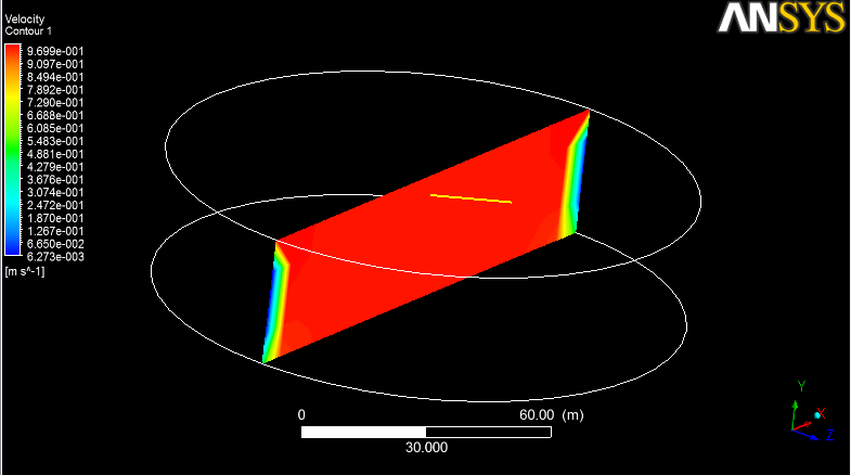
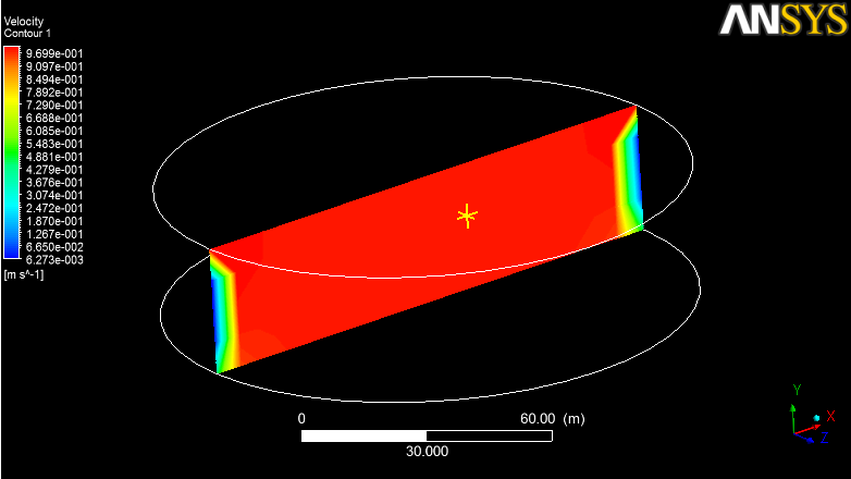
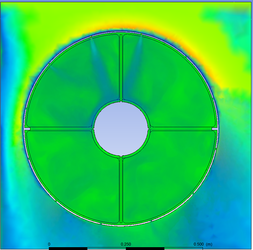
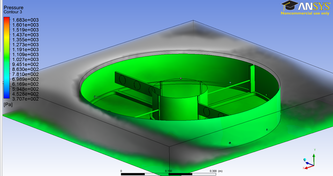
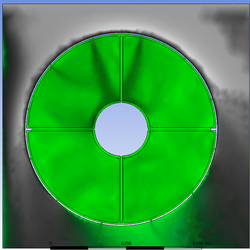
Using contour plots helps in identifying the regions of high or low values of a studied property that can be either a scalar or a vector quantity. This is done through the representation of the parameter values in different color. As an example by locating the regions of high wall shear stress you would know that that surface is playing a negative role that has to be treated with the most reasonable way.
Contour plots can be applied to 2D planes and to 3D Shapes. The researcher can benefit from the subtraction of two contour plots in locating the regions of pressure build up or pressure loss at the studied surface of a 3D shape, the same can be applied for a 2D plane.
Stream Lines
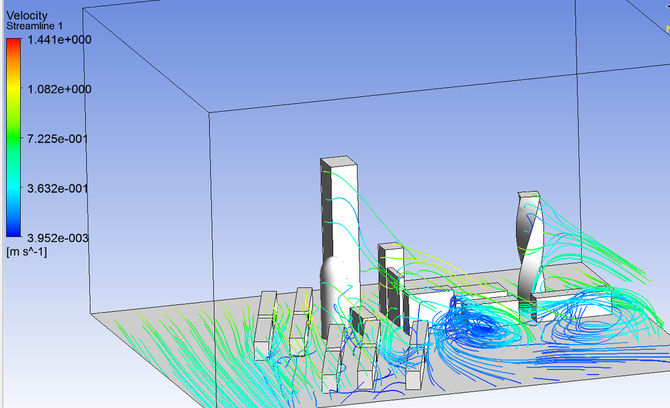
Stream lines are used to conduct a particle path visualization, where you can specify the beginning point and from that point you can follow up the path of the particle, from stream lines you can asses how the profile of the studied rigid body is slender or not. In addition you can see where regions of circulation are occurring in a 3D domain.
Stream lines can be applied to 2D planes and 3D domains.
Using Lines
Inserting 3D ines into the flow domain allows the user to make 2D plots for different types of parameters of concern through the charts plotting method.
Using Points
You can insert a point into the studied domain in order to make readings that represent an inserted prob into the flow, the prob can either represent a PIV or a pitot tube..
Vortex Core
The researcher can use vortex core visualization in order to visualize regions of high energy concentration in 3D regions. Several parameters can be visualized starting with vorticity.
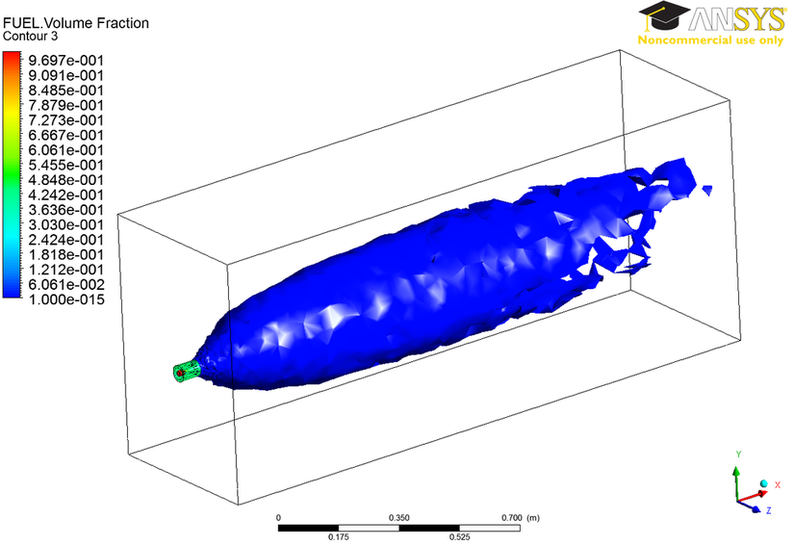
It can be used to visualize fuel sprays, circulation zones, regions of leakage,...... . . etc
Volume Rendering
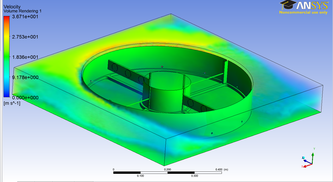
This applies a dye to the flow and shows the flow pattern occurring in the flow.
Other Methods
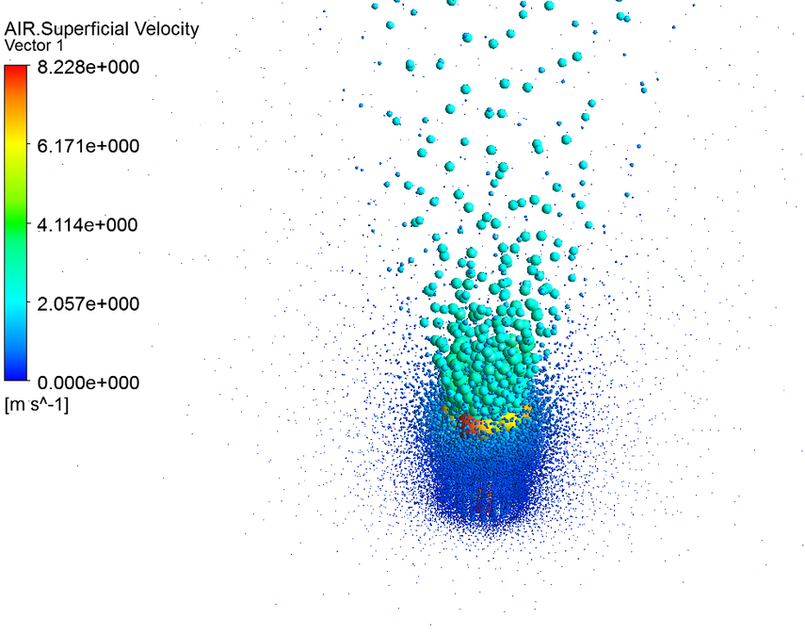
The use of first visualizing the stream lines then showing spheres moving in a tangential manner with the stream lines.
Simulation Movies
The following video shows the power of the produced videos by the CFD software
Unless otherwise noted, all content on this site is @Copyright by Ahmed Al Makky 2012-2013 - http://cfd2012.com
