MATLAB Flow Modelling
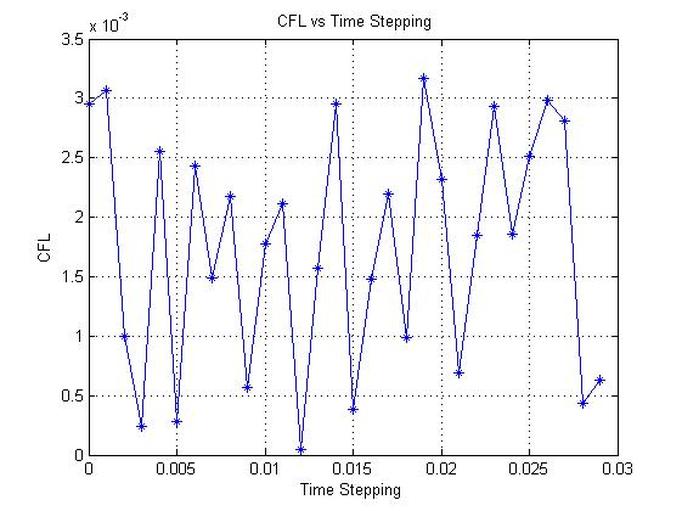
CFL Condition Trial Code
clc
clear
M=30;
t(1)=0;
for i=1:M;
dx(i)=0.3;
V(i)=rand(1,1);
dt(i)=0.001;%*rand(1,1)
t(i+1)=t(i)+dt(i);
CFL(i)=(V(i)*dt(i))/dx(i);
end
plot(t(1:M),CFL,'-*')
grid on
title(' CFL vs Time Stepping')
xlabel('Time Stepping')
ylabel('CFL')
clear
M=30;
t(1)=0;
for i=1:M;
dx(i)=0.3;
V(i)=rand(1,1);
dt(i)=0.001;%*rand(1,1)
t(i+1)=t(i)+dt(i);
CFL(i)=(V(i)*dt(i))/dx(i);
end
plot(t(1:M),CFL,'-*')
grid on
title(' CFL vs Time Stepping')
xlabel('Time Stepping')
ylabel('CFL')
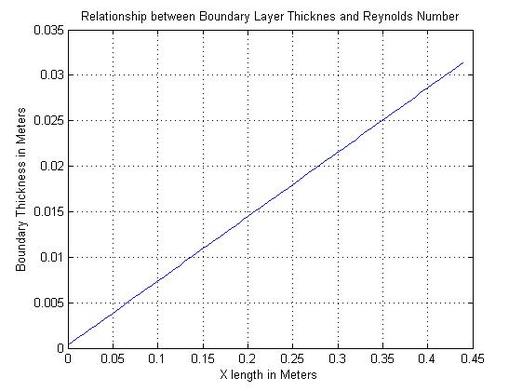
Boundary Layer Thickness
clc
clear
M=100;
Re=5000;
L=0.444;
dx=L/M;
x(1)=0;
for i=1:M;
x(i+1)=x(i)+dx;
delta(i)=5*x(i+1)/((Re)^0.5)
end
plot(x(1:M),delta)
%axis equal
grid on
title('Relationship between Boundary Layer Thicknes and Reynolds Number')
xlabel('X length in Meters')
ylabel('Boundary Thickness in Meters')
clear
M=100;
Re=5000;
L=0.444;
dx=L/M;
x(1)=0;
for i=1:M;
x(i+1)=x(i)+dx;
delta(i)=5*x(i+1)/((Re)^0.5)
end
plot(x(1:M),delta)
%axis equal
grid on
title('Relationship between Boundary Layer Thicknes and Reynolds Number')
xlabel('X length in Meters')
ylabel('Boundary Thickness in Meters')
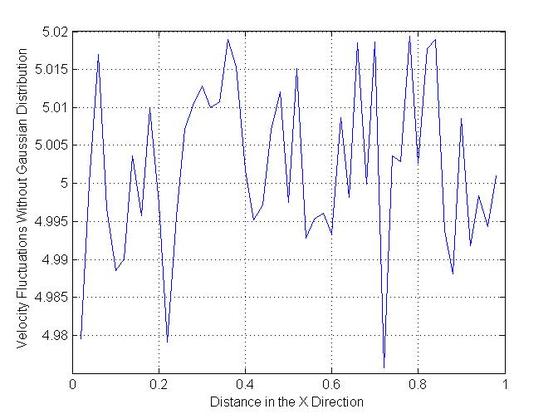
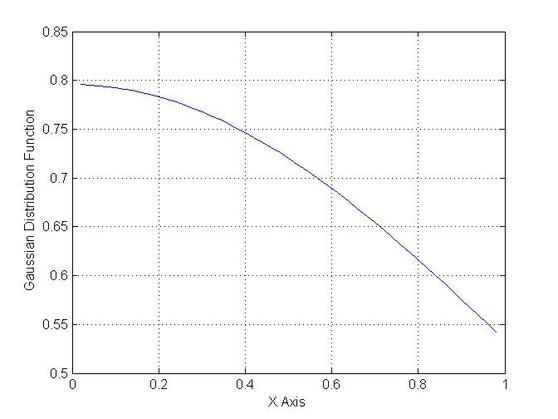
Example Gaussian Distribution Function Multiplied by Velocity
clc
clear
%THIS IS A SAMPLE CODE ON HOW TO USE A GASSIAN DISTRIBUTION FUNCTION
%ITS MAINLY USED HERE FOR AND EXAMPLE OF A ONE DIMENSIONAL FLOW WITH
%FLUCTUATING VELOCITY AND HIS A DECAY OF A GASSIAN FUNCTION I WISH THE
%READER ALL THE BEST GOOD LUCK
SGMA=sqrt(0.2);
MU=0;
A=1/(2*pi*(SGMA)^2);
B=0.5/(SGMA)^2;
L=1;
N=50;
DX=L/N;
J=0;%-0.5*N;
for I=1:N-1;
J=J+1;
X(I)=J*DX;
C(I)=(X(I)-MU)^2;
D(I)=-C(I)/B;
F(I)=A*exp(D(I));
end
figure(1)
plot(X,F)
xlabel('X Axis')
ylabel('Gaussian Distribution Function')
grid on
for I=1:N-1;
X(I)=I*DX;
VV(I)=5+0.01*randn(1,1);
V(I)=F(I)*VV(I);
end
figure(2)
plot(X,VV);
xlabel('Distance in the X Direction')
ylabel('Velocity Fluctuations Without Gaussian Distribution')
grid on
figure(3)
plot(X,V);
xlabel('Distance in the X Direction')
ylabel('Velocity')
grid on
Example
clc
clear
for ii=1:12
p=0;
N=16;
umax=2;
for i=-N:N;
p=p+1;
l=1;
dx=l/(2*N);
x(p)=i*dx;
if (p==1) urms(1)=0;
else if (p==2*N) urms(2*N)=0;
end
end
urms(p)=0.01*randn(1,1)
uu(p)=umax*(1-(x(p))^2);
u(p)=urms(p)+uu(p);
end
plot(x,u)
grid on
hold on
end
clear
for ii=1:12
p=0;
N=16;
umax=2;
for i=-N:N;
p=p+1;
l=1;
dx=l/(2*N);
x(p)=i*dx;
if (p==1) urms(1)=0;
else if (p==2*N) urms(2*N)=0;
end
end
urms(p)=0.01*randn(1,1)
uu(p)=umax*(1-(x(p))^2);
u(p)=urms(p)+uu(p);
end
plot(x,u)
grid on
hold on
end
Example
clc
clear
p=0;
N=16;
umax=2;
for i=-N:N;
p=p+1;
l=1;
dx=l/(2*N);
x(p)=i*dx;
u(p)=umax*(1-(x(p))^2);
end
plot(x,u)
grid on
clear
p=0;
N=16;
umax=2;
for i=-N:N;
p=p+1;
l=1;
dx=l/(2*N);
x(p)=i*dx;
u(p)=umax*(1-(x(p))^2);
end
plot(x,u)
grid on
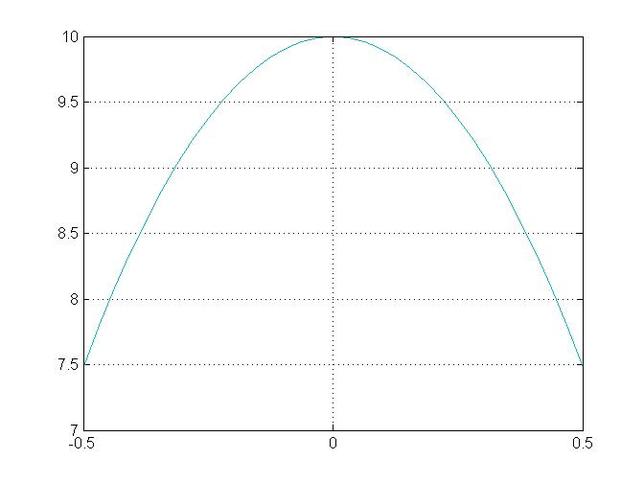
Example Velocity Profile
clc
clear
% Constants Input
L=1;
N=32;
ALPHA=32*(10)^(-6);
DT=0.1;
DX=L/N;
umax=10;
% velocity Profile
p=0;
for pp=-N/2:N/2;
p=p+1;
X(p)=pp*DX;
u(p)=umax*(1-(X(p))^2);
end
% checking paramters
% plot(u)
% x'
% u'
pp=0;
j=1;
for p=-N/2:N/2;
pp=pp+1;
if (p==-N/2)
pp;
RHS(pp,j)=ALPHA*((-2*u(pp)+u(pp+1))/(DX)^2);
elseif ((p>-N/2) & (p<N/2) )
pp;
RHS(pp,j)=ALPHA*((-2*u(pp)+u(pp+1)+u(pp-1))/(DX)^2);
elseif (p==N/2) pp; RHS(pp,j)=ALPHA*((-2*u(pp)+u(pp-1))/(DX)^2);
end
end
% checking paramters
% plot(RHS)
% RHS
% p'
% pp'
pp=0
j=1
for p=-N/2:N/2;
pp=pp+1
U(pp,j)=DT*RHS(pp,j)+u(pp) end plot(X,U)
grid on
%Time Stepping Section
pp=0; for j=1:10; pp=0; for p=-N/2:N/2; pp=pp+1;
if (p==-N/2)
pp; RHS(pp,j)=0;
elseif ((p>-N/2) & (p<N/2) ) pp; RHS(pp,j)=ALPHA*((-2*U(pp,j)+U(pp+1)+U(pp-1,j))/(DX)^2);
elseif (p==N/2) pp;
RHS(pp,j)=0;
end
end
pp=0;
for p=-N/2:N/2;
pp=pp+1
U(pp,j+1)=DT*RHS(pp,j)+U(pp,j)
end
plot(X,U)
grid on
hold on
end
Example Generating a Random 1D Velocity then Multiplying it with a Guassian Function
clc
clear
a=(2*pi)^(-0.5);
b=0.5
xx0=-10;
xx=10;
L=xx-xx0;
N=40;
dx=L/N;
x=(xx0:dx:xx);
for i=1:N+1;
y(i)=a*exp(-b*(x(i))^2);
end
figure(1)
axis equal
plot(y(:),x(:),'k');
xlabel('X Axis')
ylabel('Velocity Axis')
set(gca,'XLim',[xx0 xx],'YLim',[-2 2])
grid on
NU=size(x);
MID=0.5*(NU(2)-1)+NU(1);
for i=1:N+1
mb=randn(1,1);
if mb>1
v(i)=-rand(1,1);
else
v(i)=rand(1,1);
end
end
hold on
plot(x(:),v(:));
for i=1:N+1
V(i)=a*exp(-b*(v(i))^2);
end
plot(x(:),V(:),'r')
grid on
hold off
Using the Contour Command to Visulize a Velcoity Field
clc
clear
LX=1
LY=1
N=120
M=120
DX=LX/N
DY=LY/M
for I=1:N
for J=1:M
v(I,J)=randn(1,1);
end
end
contour(v(1:120,1:120),-1.3,'DisplayName','A(1:120,1:120)');
figure(gcf)
%for I=1:N
%for J=1:M
%plot (I,J,'.R')
%hold on
%plot (I,1:N,'.r')
%hold on
%plot (J,1:M,'--r')
%hold on
%grid on
%end
%end
clear
LX=1
LY=1
N=120
M=120
DX=LX/N
DY=LY/M
for I=1:N
for J=1:M
v(I,J)=randn(1,1);
end
end
contour(v(1:120,1:120),-1.3,'DisplayName','A(1:120,1:120)');
figure(gcf)
%for I=1:N
%for J=1:M
%plot (I,J,'.R')
%hold on
%plot (I,1:N,'.r')
%hold on
%plot (J,1:M,'--r')
%hold on
%grid on
%end
%end
1D Flow Modelling
clc
clear
% Constants Input
L=1;
N=32;
alpha=32*(10)^(-6);
dt=1;
dx=L/N;
r=(0.5*alpha*dt)/(dx)^2;
umax=10;
% velocity Profile
p=0;
for pp=-N/2:N/2;
p=p+1;
x(p)=pp*dx;
urms(p)=2*randn(1,1);
u(p)=umax*(1-(x(p))^2)+urms(p);
end
% checking paramters
% plot(u)
% x'
% u'
pp=0; j=1; for p=-N/2:N/2; pp=pp+1;
if (p==-N/2) pp; dd(pp,j)=(1-2*r)*u(pp)+r*u(pp+1);
elseif ((p>-N/2) & (p<N/2) ) pp;
dd(pp,j)=(1-2*r)*u(pp)+r*(u(pp+1)+u(pp-1));
elseif (p==N/2) pp;
dd(pp,j)=(1-2*r)*u(pp)+r*u(pp-1);
end
end
% checking paramters
% plot(dd)
% dd
% p'
% pp'
% Assigning values to the diagonal Matrix j=1;
for i=1:N+1;
a(i)=-r;
b(i)=1-2*r;
c(i)=-r;
d(i)=dd(i,j);
end
% checking paramters
% a'
% b'
% c'
% d'
% plot(d)
% Calculating the first velocity output after Initialization
[u]= TDMAsolver(a,b,c,d)';
% Assigning the calculated velocity output into a 2D matrix j=1;
for i=1:N+1;
U(i,j)=u(i);
end
% Checking the output plot(U(1:N+1,j))
hold on
grid on
title('Velocity Profiles');
xlabel('Xdirection');
ylabel('Velocity');
% Time Stepping Section j=0;
for time=1:200;
j=j+1;
for i=1:N+1;
dd(i,j+1)=U(i,j);
d(i)=dd(i,j+1);
end
[u]= TDMAsolver(a,b,c,d)';
for i=1:N+1;
U(i,j+1)=u(i);
end
plot(U(1:N+1,j+1))
hold on
end
1D Runge Kutta Flow Modelling
clc
clear
% Constants Input
L=1;
N=32;
ALPHA=32*(10)^(-6);
DT=1;
DX=L/N;
umax=100;
% velocity Profile
p=0;
for pp=-N/2:N/2;
p=p+1;
X(p)=pp*DX; u(p)=umax*(1-(X(p))^2);
end
% checking paramters
% plot(u)
% x'
% u' pp=0; j=1;
for p=-N/2:N/2;
pp=pp+1;
if (p==-N/2) pp;
RHS(pp,j)=ALPHA*((-2*u(pp)+u(pp+1))/(DX)^2);
elseif ((p>-N/2) & (p<N/2) ) pp;
RHS(pp,j)=ALPHA*((-2*u(pp)+u(pp+1)+u(pp-1))/(DX)^2);
elseif (p==N/2) pp;
RHS(pp,j)=ALPHA*((-2*u(pp)+u(pp-1))/(DX)^2);
end
end
% checking paramters
% plot(RHS)
% RHS
% p'
% pp'
pp=0
j=1
for p=-N/2:N/2;
pp=pp+1
U(pp,j)=DT*RHS(pp,j)+u(pp)
end
%plot(X,U)
%grid on %Time Stepping Section pp=0; for j=1:10; pp=0; for p=-N/2:N/2; pp=pp+1; if (p==-N/2) pp; RHS(pp,j)=0;
elseif ((p>-N/2) & (p<N/2) ) pp;
RHS(pp,j)=ALPHA*((-2*U(pp,j)+U(pp+1)+U(pp-1,j))/(DX)^2); elseif (p==N/2) pp; RHS(pp,j)=0;
end
end
pp=0;
for p=-N/2:N/2;
pp=pp+1;
k1(pp,j)=DT*RHS(pp,j);
k2(pp,j)=DT*(0.5*k1(pp,j)+DT*RHS(pp,j));
k3(pp,j)=DT*(0.5*k2(pp,j)+DT*RHS(pp,j));
k4(pp,j)=DT*(k3(pp,j)+DT*RHS(pp,j));
U(pp,j+1)=U(pp,j)+(1/6)*k1(pp,j)+(1/3)*(k2(pp,j)+k3(pp,j))+(1/6)*k4(pp,j)
end
plot(X,U)
grid on
hold on
end
Unless otherwise noted, all content on this site is @Copyright by Ahmed Al Makky 2012-2018 - http://cfd2012.com
