Example Working on Images jpg,bmp....etc
http://www.mathworks.com/products/matlab/demos.html?file=/products/demos/shipping/matlab/imagedemo.html#11
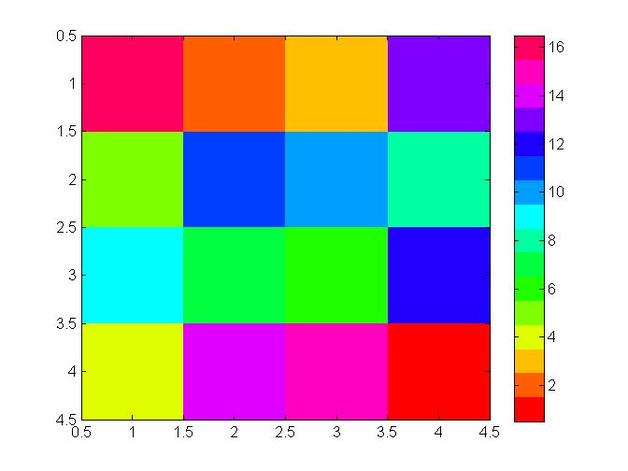
a = magic(4);
image(a);
map = hsv(16);
colormap(map)
colorbar
a = magic(4);
image(a);
map = hsv(16);
colormap(map)
colorbar
Example Creating Tables in MATLAB
Create a that has a row with the following , called mydata.txt:
u v w p t
Then write the code
clc
clear
[names1, names2, names3, names4, names5] = textread('mydata.txt','%s %s %s %s %s',1);
Working with strings http://www.mathworks.co.uk/help/techdoc/ref/textread.html
u v w p t
Then write the code
clc
clear
[names1, names2, names3, names4, names5] = textread('mydata.txt','%s %s %s %s %s',1);
Working with strings http://www.mathworks.co.uk/help/techdoc/ref/textread.html
ExampleTracying a profile from an image file
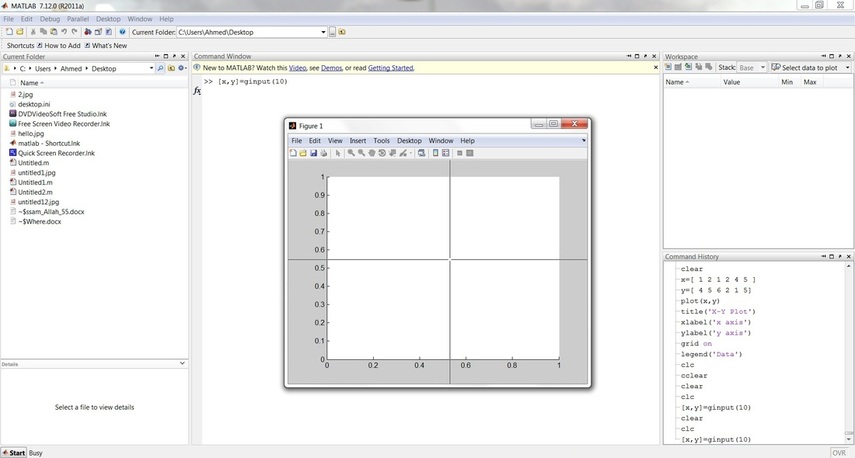
It is a usefull command to use by importing and image and selecting the cooordinates of a number of points
[x,y]=ginput(10)
More info go to :http://www.mathworks.com/help/techdoc/ref/ginput.html
[x,y]=ginput(10)
More info go to :http://www.mathworks.com/help/techdoc/ref/ginput.html
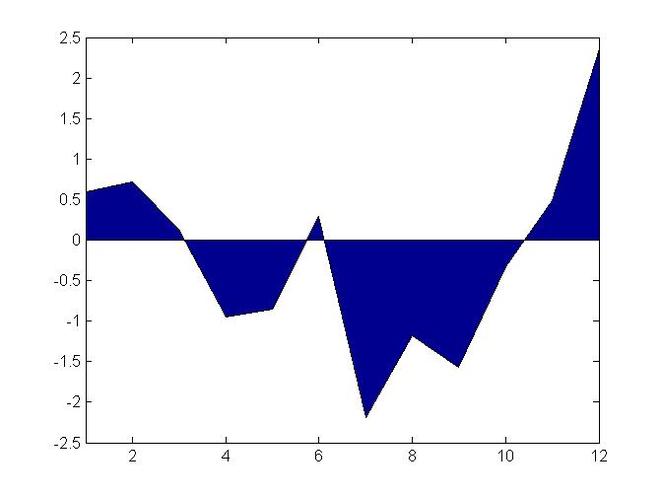
Example Using The Area Command
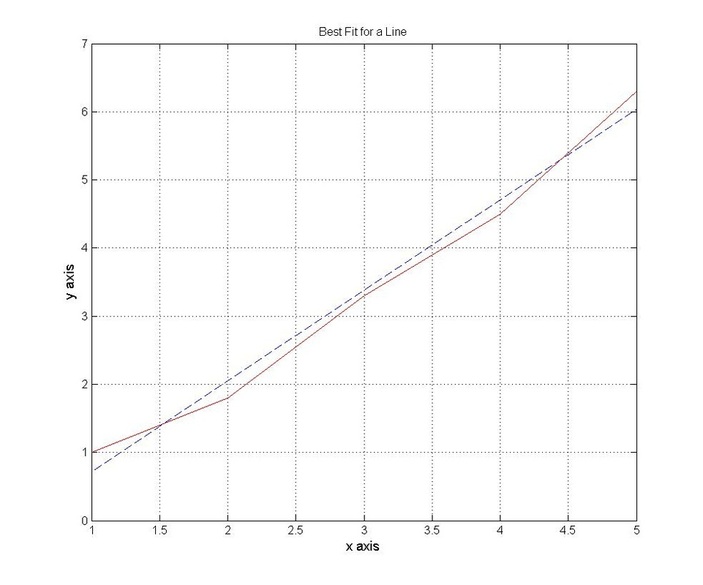
Example Best Fit for a Set of Data to a Line
clc
clear
x1=(0:1:4);
y1=[ 1 1.8 3.3 4.5 6.3 ];
nn=size(x1);
for i=1:nn(2);
z1(i)=x1(i)*y1(i);
z2(i)=x1(i)*x1(i);
end
check1=sum(x1);
check2=sum(y1);
check3=sum(z1);
check4=sum(z2);
A(1,1:2)=[nn(2) check1 ];
A(2,1:2)=[check1 check4];
B(1,1:2)=[check2 check3]
BB=(A^-1)*B'
for i=1:nn(2);
x(i)=x1(i);
y(i) = BB(1)+BB(2)*x(i)
end
plot(y,'--')
hold on
plot(y1,'r')
title('Best Fit for a Line')
xlabel('x axis','FontSize',12)
ylabel('y axis','FontSize',12)
grid on
Example Reading an Image into Matlab
The user can change the name and extention of the studied material .
[x,map]=imread('flowers.tif');
image(x)
colormap(map)
[x,map]=imread('flowers.tif');
image(x)
colormap(map)
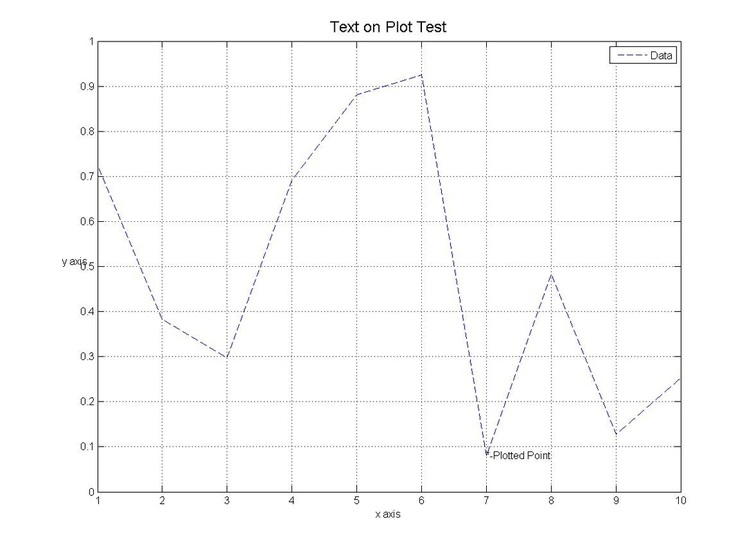
Example Performing Cosmetics on a Generated Plot
clc
clear
M=10;
N=10;
for i=1:M;
x(i)=rand(1,1)
end
y=(1:1:N)
figure(1)
plot(y,x,'--');
title('Text on Plot Test','FontSize',15);
text(y(7),x(7),'*-Plotted Point','FontSize',10)
grid on
legend('Data');
xlabel('x axis','FontSize',10)
ylabel('y axis','Rotation',0,'FontSize',10)
clear
M=10;
N=10;
for i=1:M;
x(i)=rand(1,1)
end
y=(1:1:N)
figure(1)
plot(y,x,'--');
title('Text on Plot Test','FontSize',15);
text(y(7),x(7),'*-Plotted Point','FontSize',10)
grid on
legend('Data');
xlabel('x axis','FontSize',10)
ylabel('y axis','Rotation',0,'FontSize',10)
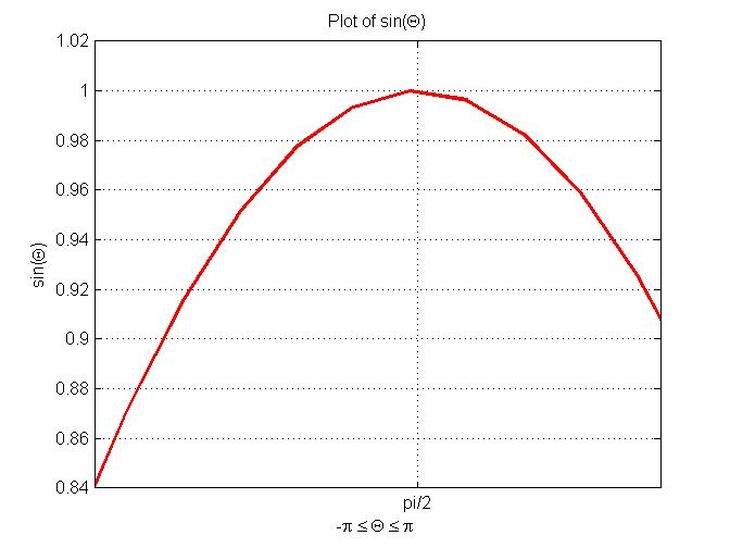
Example Specfiying Plotting Ranges
clc
clear
x = -pi:.1:pi;
y = sin(x);
p = plot(x,y)
set(gca,'XLim',[1 2]) % Change the values of the numbers in brackets which represents the data range
set(gca,'XTick',-pi:pi/2:pi)
set(gca,'XTickLabel',{'-pi','-pi/2','0','pi/2','pi'})
xlabel('-\pi \leq \Theta \leq \pi')
ylabel('sin(\Theta)')
grid on
title('Plot of sin(\Theta)')
text(-pi/4,sin(-pi/4),'\leftarrow sin(-\pi\div4)', 'HorizontalAlignment','left')
set(p,'Color','red','LineWidth',2)
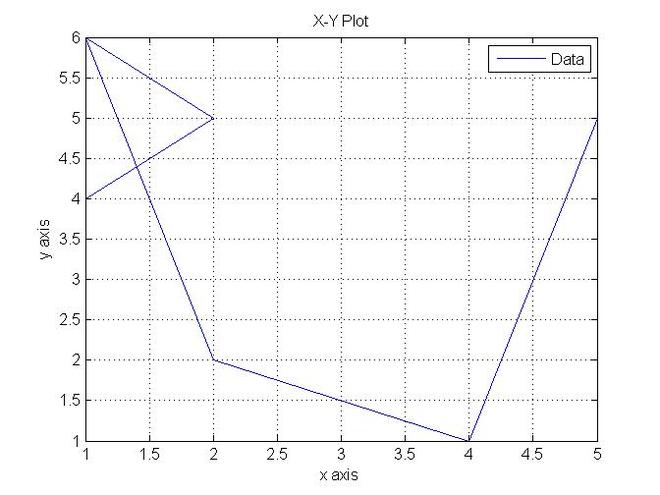
Example Plotting a Simple Set of Data
clc
clear
x=[ 1 2 1 2 4 5 ]
y=[ 4 5 6 2 1 5]
plot(x,y)
title('X-Y Plot')
xlabel('x axis')
ylabel('y axis')
grid on
legend('Data')
clear
x=[ 1 2 1 2 4 5 ]
y=[ 4 5 6 2 1 5]
plot(x,y)
title('X-Y Plot')
xlabel('x axis')
ylabel('y axis')
grid on
legend('Data')
Note 1 :Getting the wanted plot settings playing around with the aspect Ratio:
These are the required commands,for a 2D plot.
A-axis equal
B-axis equal tight
C-axis square
D-axis normal
Note 2 :Curve fitting.
Example Saving a Generated Image in png Format into a Default Folder
image = rand(400, 400, 3);
imwrite(image, 'File_name_1.png')
imwrite(image, fullfile(cd, 'File_name_1.png'))
imwrite(image, 'File_name_1.png')
imwrite(image, fullfile(cd, 'File_name_1.png'))
Example Genrating an Image in jpg format onto the Default folder
image = rand(400, 400, 3);
B = double(image);
imshow(B);
imwrite(B, 'new_image.jpg', 'jpg')
B = double(image);
imshow(B);
imwrite(B, 'new_image.jpg', 'jpg')
A good link is one that is by Mathsworks :
http://www.mathworks.co.uk/products/matlab/examples.html?file=/products/demos/shipping/matlab/imagedemo.html#11
http://www.mathworks.co.uk/products/matlab/examples.html?file=/products/demos/shipping/matlab/imagedemo.html#11
Example Making a Simple Movie
clc
clear
for i = 1:32
plot(peaks(i+4))
axis equal
M(i) = getframe;
end
movie(M,5,6)
clear
for i = 1:32
plot(peaks(i+4))
axis equal
M(i) = getframe;
end
movie(M,5,6)
Good Links
https://sites.google.com/site/amgsmatlabtutorial/home/page-2/page-3/page-4-multimedia-data
http://www.mpeg.org/MPEG/products/configuring-your-web-browser-to-play-mp3.html
http://www.mathworks.co.uk/help/matlab/ref/imwrite.html#f25-720264
https://sites.google.com/site/amgsmatlabtutorial/home/page-2/page-3/page-4-multimedia-data
http://www.mpeg.org/MPEG/products/configuring-your-web-browser-to-play-mp3.html
http://www.mathworks.co.uk/help/matlab/ref/imwrite.html#f25-720264
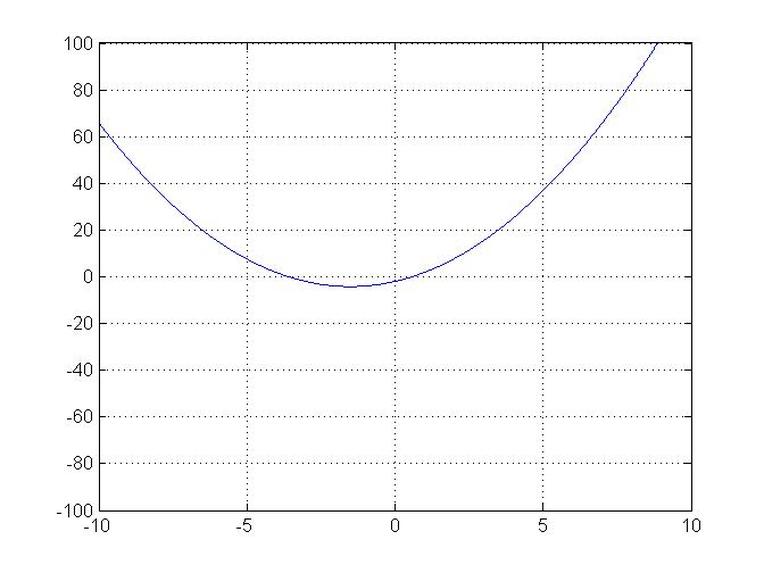
Example Making a simulation using the Erase Mode
clear
clc
clf
for l=1:60;
x=-10:0.01:10;
k=-1; y=k*x.^2+3*k*x-2;
h=plot(x,y);
grid on
set(h,'EraseMode','xor')
axis([-10,10,-100,100])
while k<1
k=k+0.01;
y=k*x.^2+3*k*x-2;
set(h,'XData',x,'YData',y)
drawnow
end
end
clc
clf
for l=1:60;
x=-10:0.01:10;
k=-1; y=k*x.^2+3*k*x-2;
h=plot(x,y);
grid on
set(h,'EraseMode','xor')
axis([-10,10,-100,100])
while k<1
k=k+0.01;
y=k*x.^2+3*k*x-2;
set(h,'XData',x,'YData',y)
drawnow
end
end
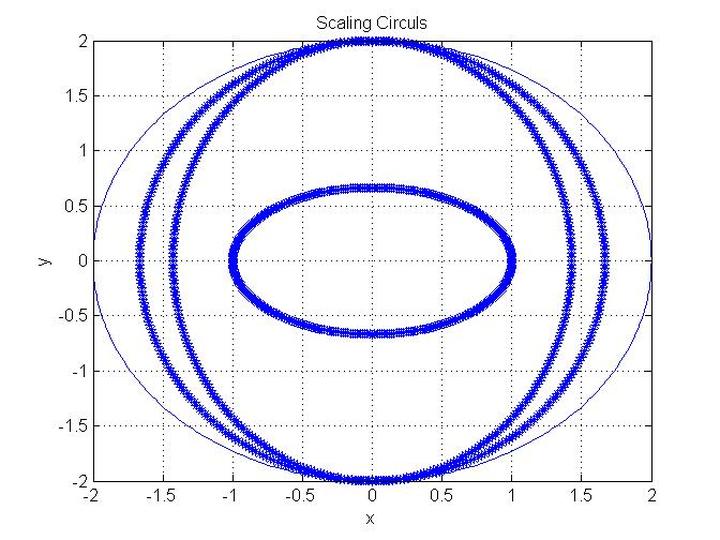
Example Scaling a Circual in X axis Direction and Y axis Direction
clc
clear
r=2;
N=360;
theta(1)=0;
for i=1:N
theta(i+1)=theta(i)+1;
alpha(i)=(pi/180)*theta(i+1)
end
for i=1:N;
x(i)=r*cos(alpha(i));
y(i)=r*sin(alpha(i));
end
plot(x,y)
grid on
hold on
for i=1:N;
xx(i)=x(i)/1.2;
y(i)=r*sin(alpha(i));
end
plot(xx,y,'*')
hold on
for i=1:N;
xx(i)=x(i)/1.4;
y(i)=r*sin(alpha(i));
end
plot(xx,y,'*')
hold on
for i=1:N;
xx(i)=x(i)/2;
yy(i)=y(i)/3;
end
plot(xx,yy,'*')
title('Scaling Circuls')
xlabel('x')
ylabel('y')
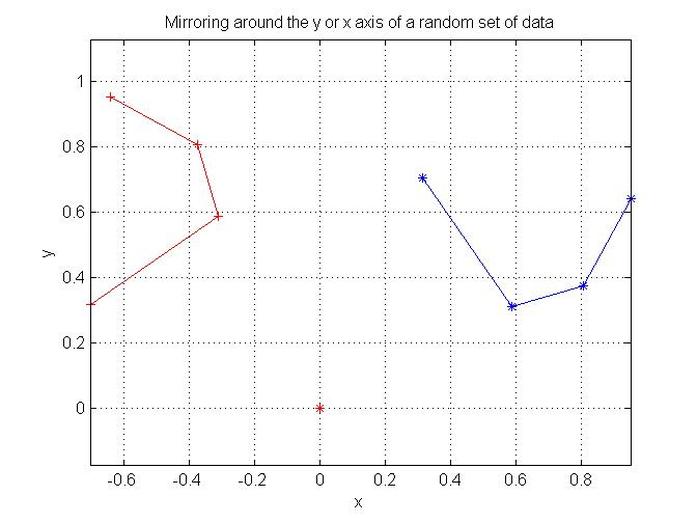
Example Rotating a Number of Randomly Generated Points
clc
clear
%Number of points
N=5;
%coordinates of coordinate system
x(1)=0;
y(1)=0;
%Generating the random set of points
for i=2:N;
x(i)=rand(1,1);
y(i)=rand(1,1);
end
plot(x(2:N),y(2:N),'-*')
grid on
%Mirroring Angle around y axis
deg1=90; th1=(pi/180)*deg1;
%Mirroring Angle around x axis
deg2=deg1; th2=(pi/180)*deg2;
%The point rotation section
for i=2:N;
theta(i)=atan((y(i)-y(1))/(x(i)-x(1)));
r(i)=(x(i)-x(1))/cos(theta(i));
xx(i)=r(i)*cos(theta(i)+th1)+x(1);
%r(i)=(y(i)-y(1))/sin(theta(i));
yy(i)=r(i)*sin(theta(i)+th2)+y(1);
end
hold on
plot(xx(2:N),yy(2:N),'-+r')
title('Mirroring around the y or x axis of a random set of data')
xlabel('x')
ylabel('y')
%legned('orginal','mirrored')
axis equal
plot(x(1),y(1),'*r');
hold off
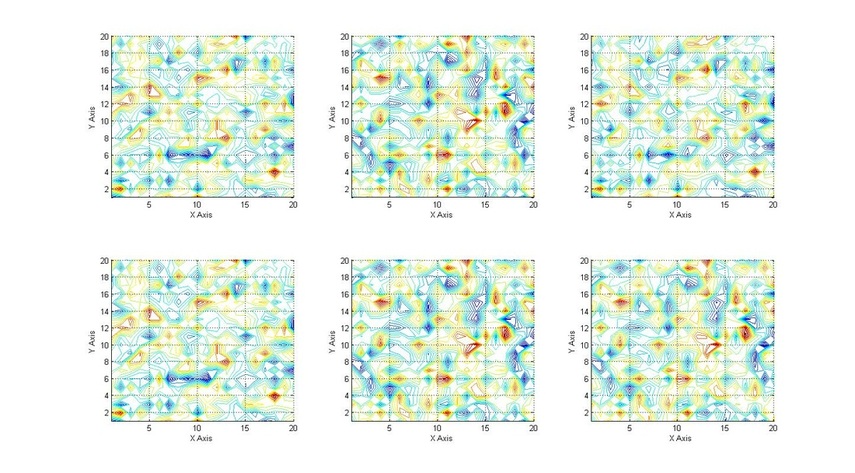
Data Comparison
clc
clear
M=20;
N=20;
z=3;
for i=1:M;
for j=1:N;
Q(i,j,z)=randn;
end
end
z=4;
for i=1:M;
for j=1:N;
Q(i,j,z)=randn;
end
end
fyi=0.7;
for i=1:M;
for j=1:N;
Q(i,j,5)=fyi*Q(i,j,3)+(1-fyi)*Q(i,j,4);
end
end
beta=0.1;
fyi=beta;
for i=1:M;
for j=1:N;
Q(i,j,6)=fyi*Q(i,j,3)+(1-fyi)*Q(i,j,4);
end
end
figure('Position',[10 10 1600 800])
subplot 231
contour(Q(:,:,3),19)
Xlabel('X Axis')
ylabel('Y Axis')
grid on
subplot 232
contour(Q(:,:,4),19)
Xlabel('X Axis')
ylabel('Y Axis')
grid on
subplot 233
contour(Q(:,:,5),19)
Xlabel('X Axis')
ylabel('Y Axis')
grid on
subplot 234
contour(Q(:,:,3),19)
Xlabel('X Axis')
ylabel('Y Axis')
grid on
subplot 235
contour(Q(:,:,4),19)
Xlabel('X Axis')
ylabel('Y Axis')
grid on
subplot 236
contour(Q(:,:,6),19)
Xlabel('X Axis')
ylabel('Y Axis')
grid on
Unless otherwise noted, all content on this site is @Copyright by Ahmed Al Makky 2012-2018 - http://cfd2012.com
