Reading Data In and Out of MATLAB
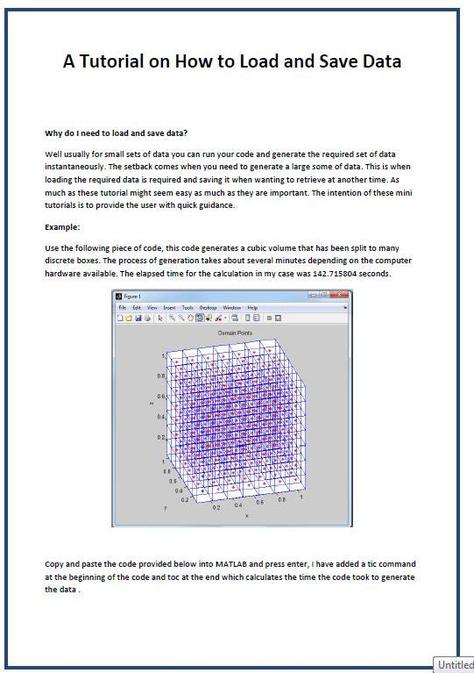
The following document can be downloaded, press on the image below.
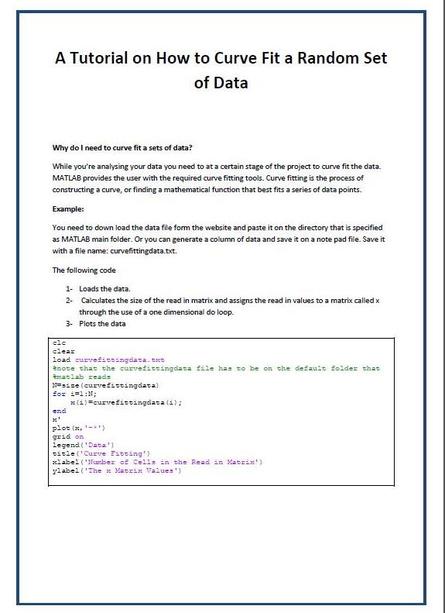
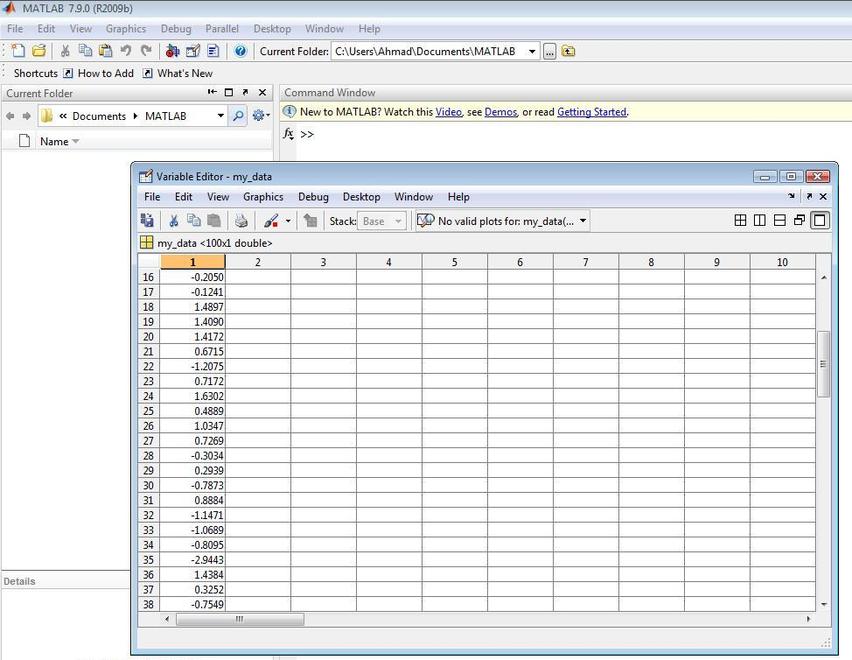
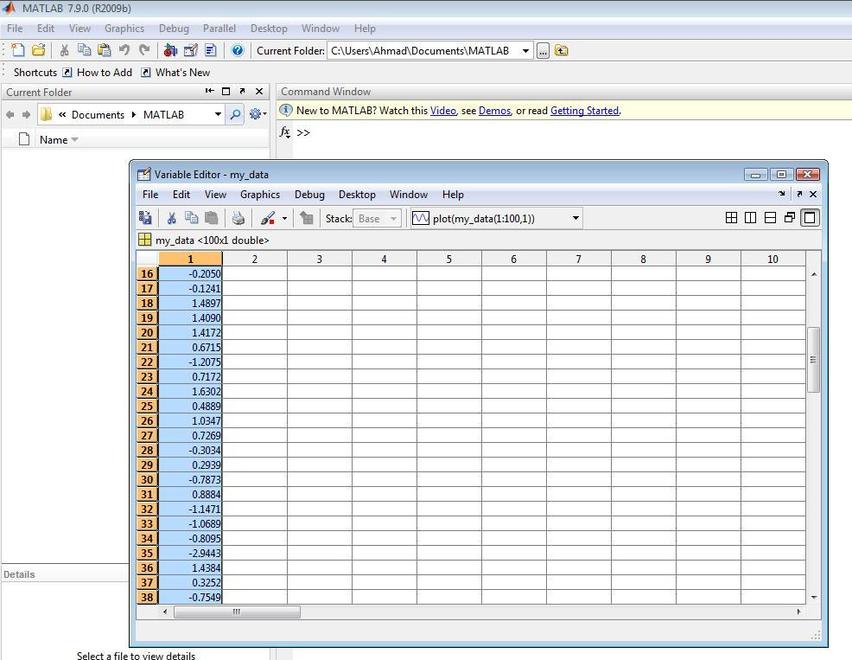
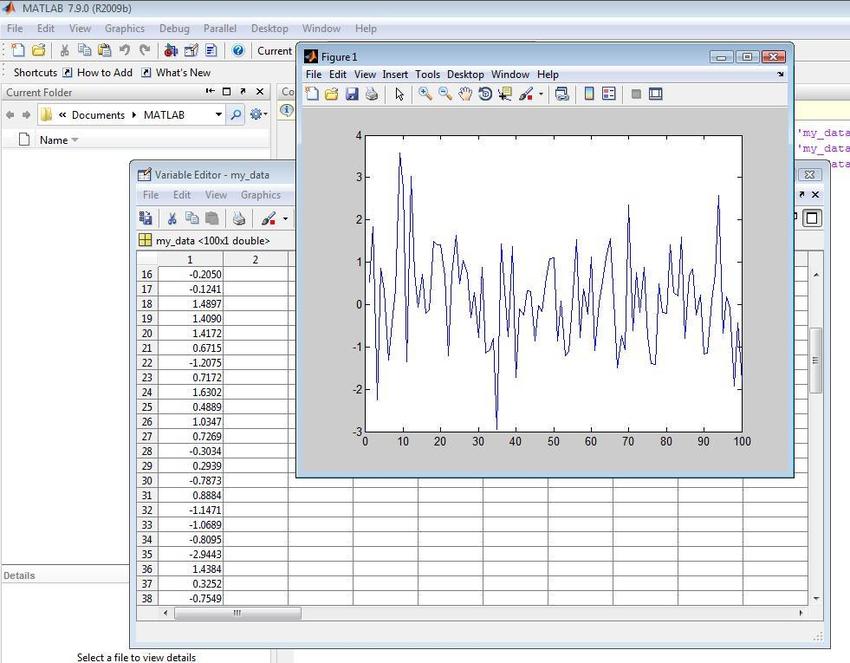
Tutorial 2, shows the steps on how to read data into MATLAB and then curve fitting the data
Reading in an Image for Analysis
During your research process, you would be required to do some data analysis through reading an image into MATALB and analyzing the data according to the researchers needs. Later I will have to get the the required height of the picture in the equivalent relation to the number of matrix cells of the picture:
Example
clc
clear
filename = 'file_name.txt'
A = importdata(filename);
clear
filename = 'file_name.txt'
A = importdata(filename);
Example
clc
clear
[x,map]=imread('CFX11.jpg');
figure('Position',[200 100 1500 830])
image(x)
axis equal
set(gca,'XLim',[0 1150],'YLim',[0 210])
dist=600;
height=210;
M=height;
for j=1:3
for i=1:M
xx(i,j)=x(i,dist,j);
end
end
xxx=double(x);
for i=1:M;
t=xxx(i,1);
tt=xxx(i,2);
ttt=xxx(i,3);
v(i,1:3)=[ t tt ttt ];
V(i)=norm(v(i,1:3));
end
VV=V';
y1=(1:1:M);
% save('pqfile.txt', 'VV', '-ASCII' )
%open pqfile.txt
hold on
plot(VV+dist,y1,'-')
hold off
figure(2)
plot(VV,y1)
set(gca,'XLim',[0 450],'YLim',[0 210])
%axis equal
grid on
xlabel('Temperature (K)')
ylabel('Y distance (mm)')
The following image should be saved in the default folder of intrest inorder to read it into MATLAB:
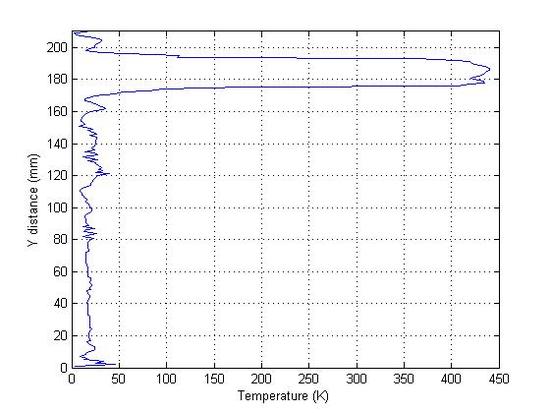
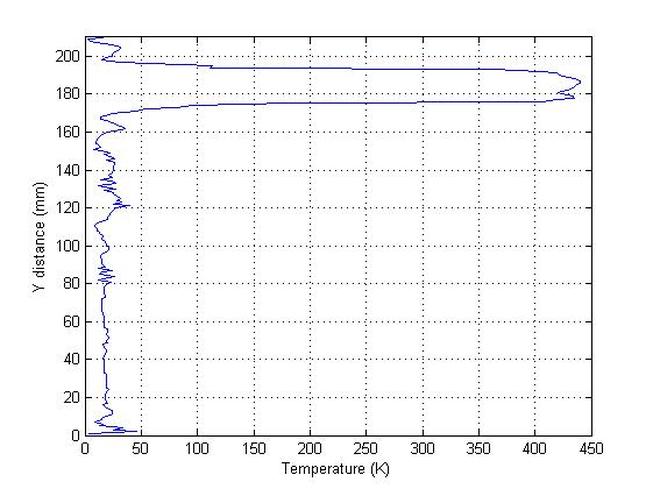
The following output should result from the studied image:
Not sure yet why I am not getting the image read in as prevously done
Example
clc
clear
M=10;
[Z,map] = imread('ahmed1.jpg');
image(Z);axis equal
grid on
[X,Y]=ginput(M)
close
for i=M:1
plot(X(i),Y(i),'*')
hold on
end
for i=1:M-1
VX=[X(i),X(i+1)]
VY=[Y(i),Y(i+1)]
line(VX,VY)
end
hold on
plot(0,0)
% If you want to close the drawing
% VX=[X(M),X(1)]
% VY=[Y(M),Y(1)]
% line(VX,VY)
axis equal
grid on
Reading in Data into MATLAB
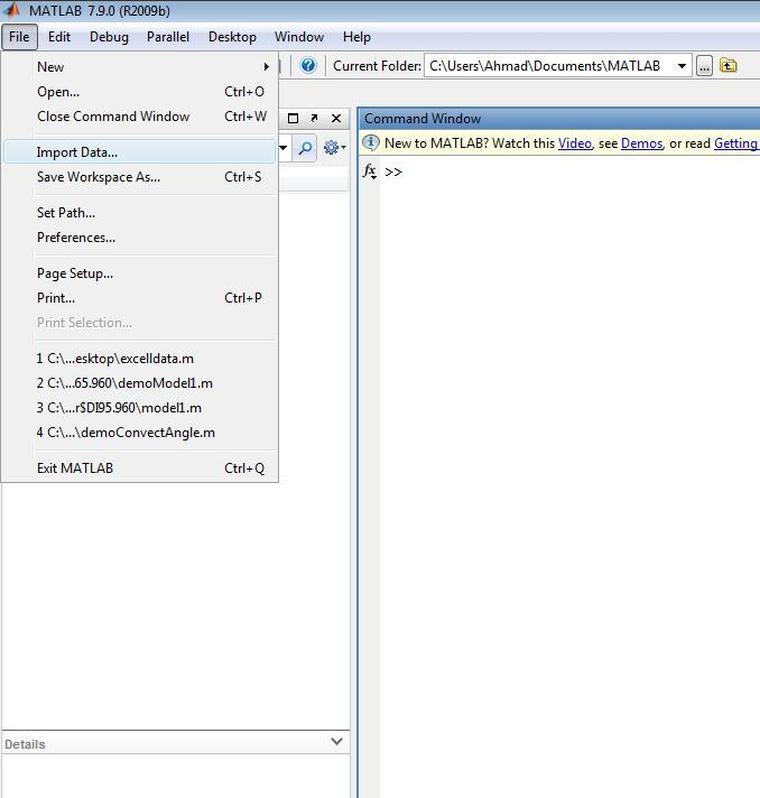
Step 1
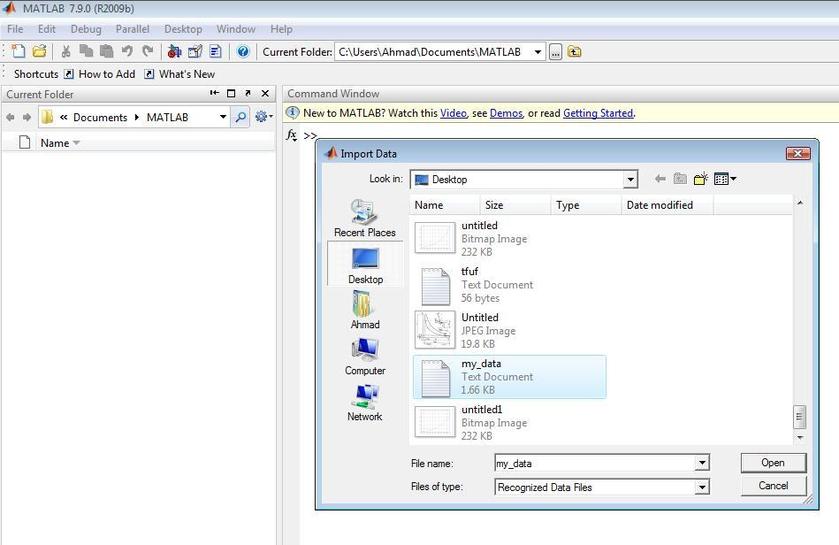
Step 2
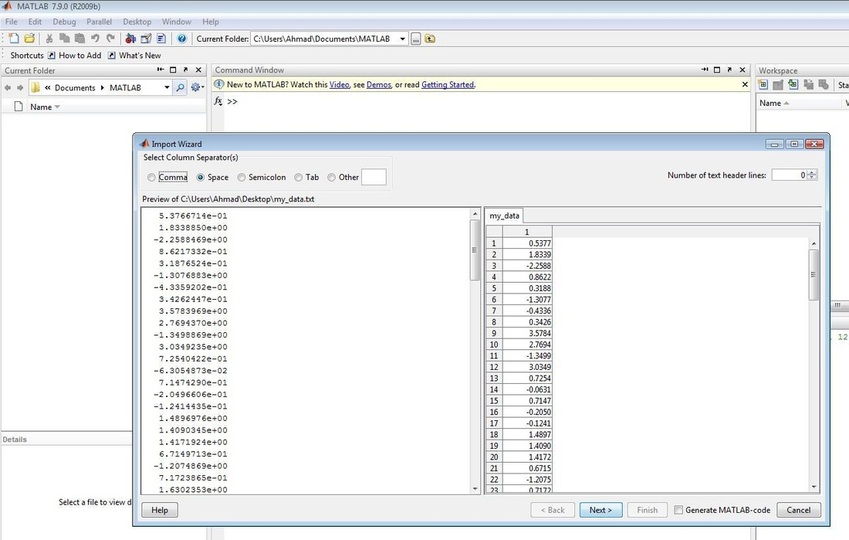
Step 3
Step 4
Step 5
Step 6
Unless otherwise noted, all content on this site is @Copyright by Ahmed Al Makky 2012-2013 - http://cfd2012.com
