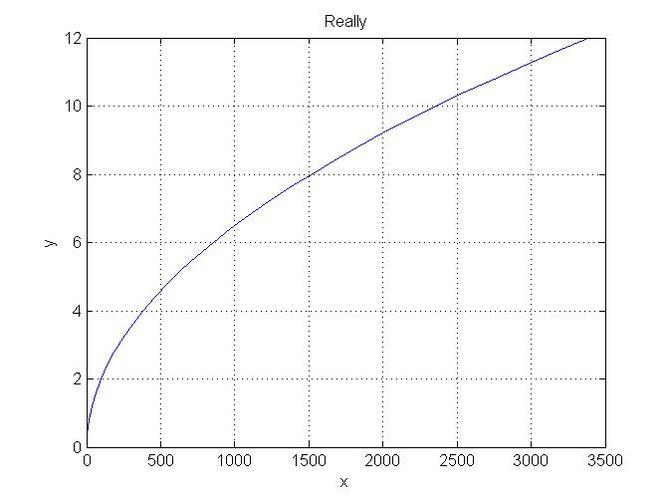
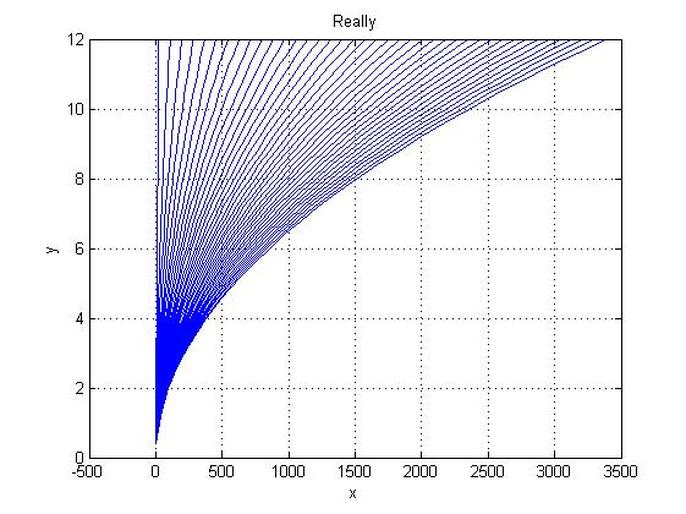
Example
clc
clear
M=30;
N=40;
L=12;
x0=0;
x1=x0+L;
dx=L/M;
xx=[ x0:dx:x1 ];
for j=1:N;
for i=1:M;
x(i,j)=xx(i);
end
end
a(1)=0;
for j=1:N;
a(j+1)=a(j)+0.3;
for i=1:M;
x(i,j)=i*dx;
y(i,j)=2*a(j)*(x(i,j))^2+2*x(i,j)-1;
end
end
for j=1:N;
plot(y(:,j),x(:,j));
grid on
xlabel('x')
ylabel('y')
title('Really')
MM(j) = getframe;
end
pause(3)
figure(2)
xlabel('x')
ylabel('y')
title('Really')
frame_order = [1:N 2:1:N];
number_repeats = 1;
movie(MM, [number_repeats frame_order]);
Eample
clc
clear
M=30;
N=40;
L=12;
x0=0;
x1=x0+L;
dx=L/M;
xx=[ x0:dx:x1 ];
for j=1:N;
for i=1:M;
x(i,j)=xx(i);
end
end
a(1)=0;
for j=1:N;
a(j+1)=a(j)+0.3;
for i=1:M;
x(i,j)=i*dx;
y(i,j)=2*a(j)*(x(i,j))^2+2*x(i,j)-1;
end
end
for j=1:N;
plot(y(:,j),x(:,j));
hold on grid on
xlabel('x')
ylabel('y')
title('Really') MM(j) = getframe;
end
pause(3)
figure(2)
xlabel('x')
ylabel('y')
title('Really')
frame_order = [1:N 2:1:N];
number_repeats = 1;
movie(MM, [number_repeats frame_order]);
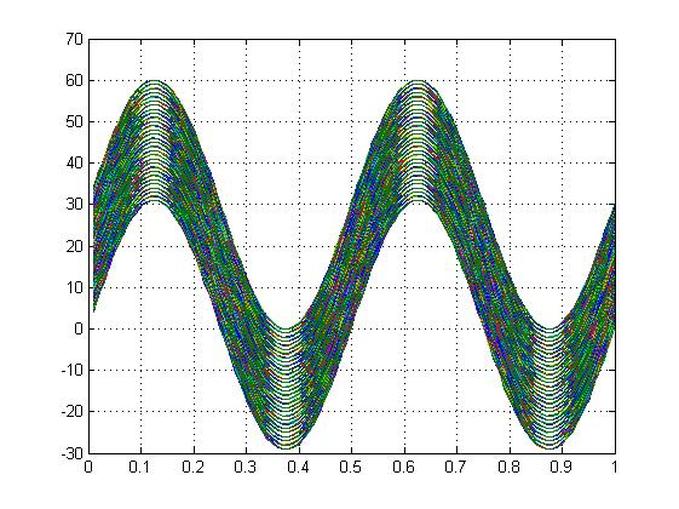
Example
clc
clear
M=100;
N=20;
L=1;
dx=L/M;
for j=1:N;
dt(j)=0.001*j;
for i=1:M;
xxx(i,j)=i*dx;
x(i,j)=0.1*randn(1,1);
xx(i,j)=2*sin(dt(j))+x(i,j);
end
end
for j=1:N;
plot(xx(:,j),'-r')
area(xx(:,j))
title('Viva')
xlabel('x')
ylabel('y')
axis([ 1 10 -0.6 0.6 ])
grid on
MM(j) = getframe;
end
frame_order = [1:N 14:-1:1];
number_repeats = 1;
movie(MM, [number_repeats frame_order]);
figure(2)
t = 0:0.01:10*pi; x = t.*sin(t); y = t.*cos(t);
axislimits = [min(x) max(x) min(y) max(y) min(t) max(t)];
line_handle = plot3(x(1), y(1),t(1), 'ko', ...
'MarkerFaceColor',[.49 1 .63], 'MarkerSize',12);
set(line_handle, 'erasemode','xor');
axis(axislimits);
grid on
for i = 2:length(x)
set(line_handle, 'xdata',x(i), 'ydata', y(i), 'zdata', t(i));
drawnow;
end
figure(3)
Z = peaks; surf(Z)
axis tight
set(gca,'NextPlot','replacechildren');
for j = 1:20
surf(sin(2*pi*j/20)*Z,Z)
F(j) = getframe;
end
movie(F,20)
Example String Simulation
The bessel function command used in this code has been changed, need to find the new command format
clc
clear
x = [1:1:100];
y=15*x.^2;
for j = 1:15
z = bessel(0, (j-1)*0.2 + sqrt(x.^2 +y.^2));
plot(z)
grid on
xlabel('x')
ylabel('y')
zlabel('z')
grid on
title('Viva')
axis([ 1 4 -1 1 ])
M(j) = getframe;
end
frame_order = [1:15 14:-1:1];
number_repeats = 2;
movie(M, [number_repeats frame_order]);
clear
x = [1:1:100];
y=15*x.^2;
for j = 1:15
z = bessel(0, (j-1)*0.2 + sqrt(x.^2 +y.^2));
plot(z)
grid on
xlabel('x')
ylabel('y')
zlabel('z')
grid on
title('Viva')
axis([ 1 4 -1 1 ])
M(j) = getframe;
end
frame_order = [1:15 14:-1:1];
number_repeats = 2;
movie(M, [number_repeats frame_order]);
Example Pie Timer Simulation
clc
clear
r=10;
L=2*pi*r
M=20;
DL=L/M;
dr=r/M;
dtheta=DL/r
theta(1)=0;
Beta(1)=2*pi;
DR(1)=0;
q=1;
vector(1,1:2)=[ theta(1) Beta(1) ]
for i=1:M;
q=q+1;
theta(i+1)=theta(i)+dtheta;
Beta(i+1)=2*pi-theta(i+1)
t=theta(i+1)
tt=Beta(i+1)
vector(q,1:2)=[ t tt ]
beep
pause(0.1)
end
theta';
for i=1:M+1;
figure(i)
pie(vector(i,1:2))
pause(0.5)
close
end
clc
display('Finshed Running Code')
display('Thanks for Trying the Code')
Example
clc
clear
M=100;
N=100;
LX=1;
LY=1;
DX=LX/M;
DY=LY/N;
f=2;
T=30;
for tt=1:T;
for t=1:T;
a=0;
for i=1:M;
a=a+1;
for j=1:N;
X(i,j,t,tt)=i*DX;
Y(i,j,t,tt)=j*DY;
W(i,j,t,tt)=2*pi*f;
YY(i,j,t,tt)=0.01*randn(1,1);
Y(i,j,t,tt)=(0.05+tt)*sin(W(i,j,t,tt)*X(i,j,t,tt)+YY(i,j,t,tt))+t;
end
end
end
end
for tt=1:T;
for t=1:T;
plot(X(:,:,t,tt),Y(:,:,t,tt));
hold on
end
hold off
pause(0.1)
end
grid on
Unless otherwise noted, all content on this site is @Copyright by Ahmed Al Makky 2012-2013 - http://cfd2012.com


