Linear Data Analysis in CFD-Post
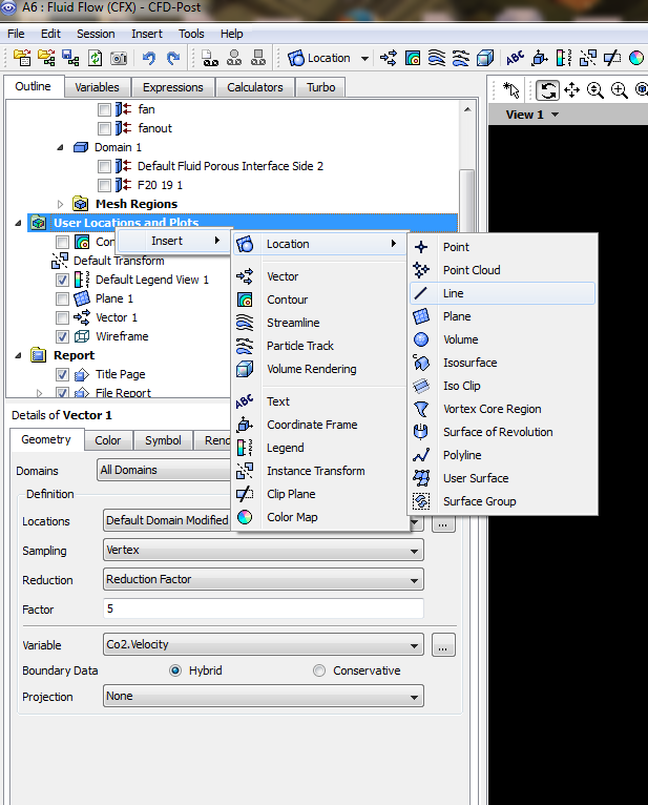
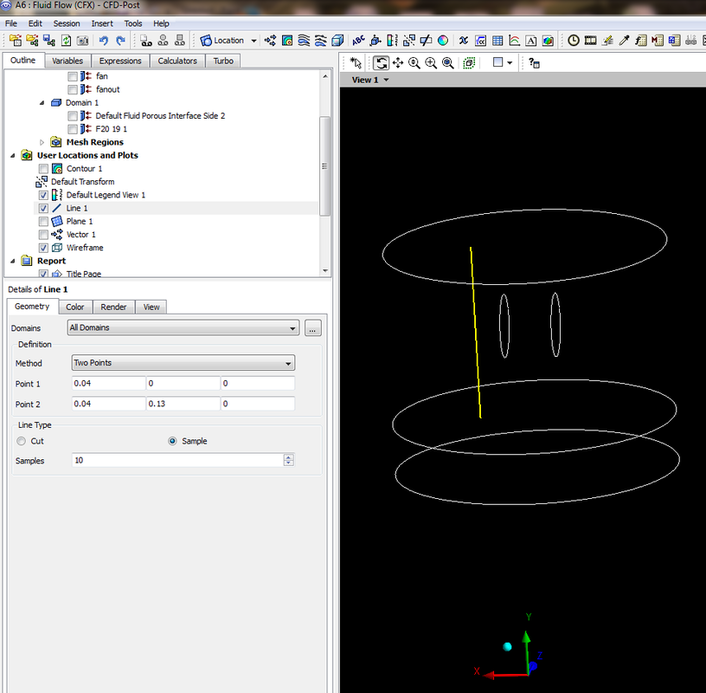
Inserting a line will help in specifying what cells need to be saved and plotted.
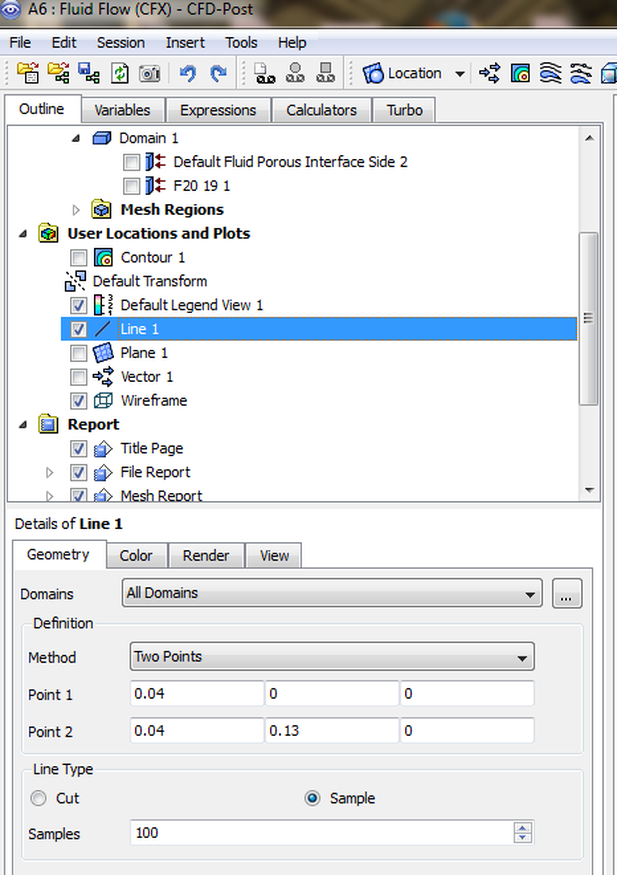
Enter the coordinates for the required line.
Increasing the number of samples gives the plotted curve much a smother profile.
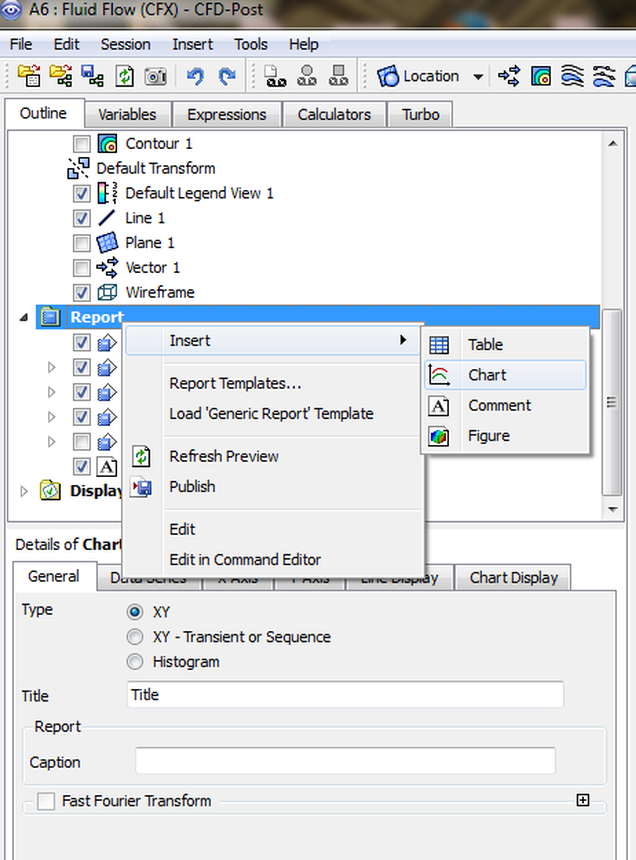
Right click Report and through Insert got to Chart:
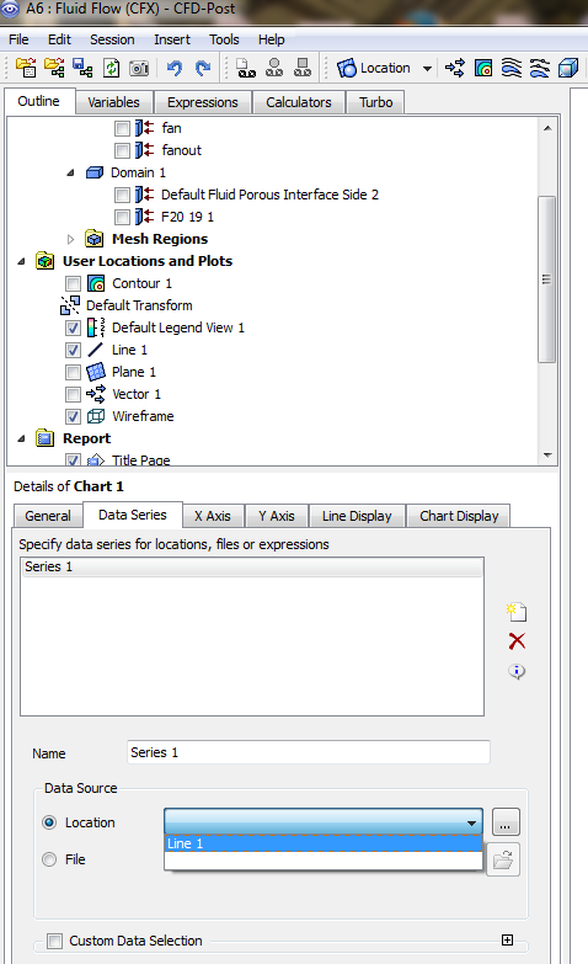
Select from the Location drop down list the Line 1:
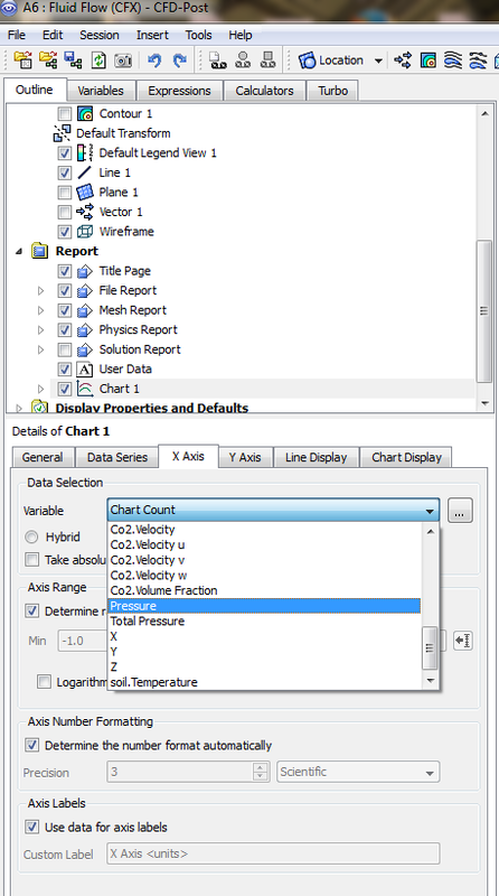
Specifying the parameter for x axis, for example I have chosen Pressure.
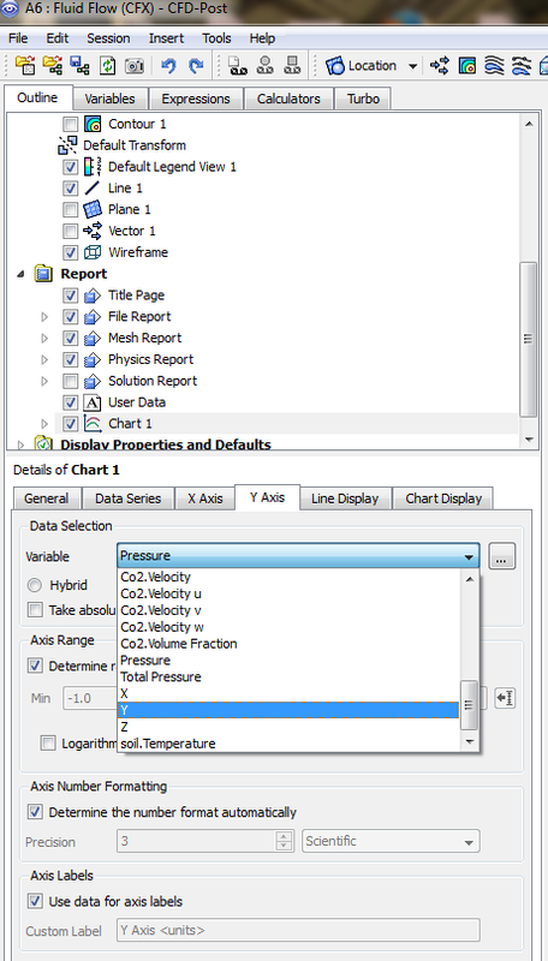
Specifying the parameter for the y axis:
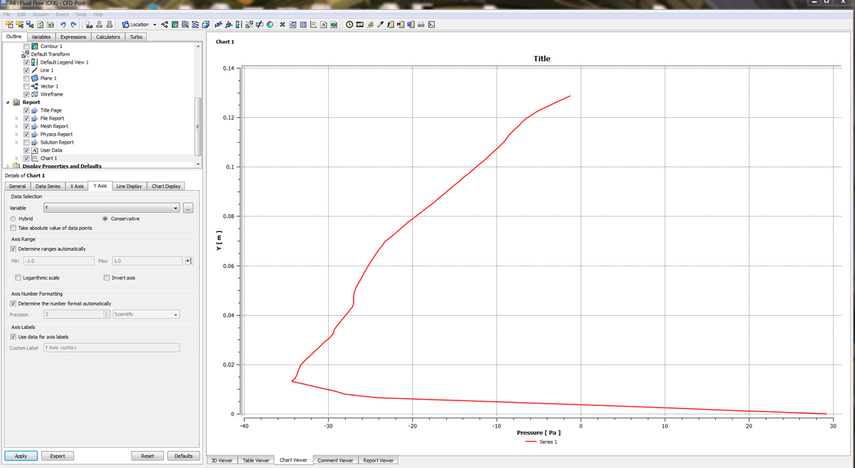
A sample of how the plotted data should look like
Unless otherwise noted, all content on this site is @Copyright by Ahmed Al Makky 2012-2013 - http://cfd2012.com
