Generating a Temperature 1D Series
clc
clear
L=10;
for i=1:L;
t(i)=1.2*randn;
end
for i=1:L;
T(i)=t(i)+273;
end
plot(T)
title('Temperature Vs Number of Readings')
grid on
xlabel('Number of Readings of Temperature')
ylabel('Temperature (K)')
clear
L=10;
for i=1:L;
t(i)=1.2*randn;
end
for i=1:L;
T(i)=t(i)+273;
end
plot(T)
title('Temperature Vs Number of Readings')
grid on
xlabel('Number of Readings of Temperature')
ylabel('Temperature (K)')
Studying the Ideal Gas Equation in a 2D Plane
clc
clear
M=10;
R=8.314;
for j=1:M;
for i=1:M;
v(i,j)=100000*rand(1,1);
t(i,j)=randn+20;
T(i,j)=t(i,j)+273;
p(i,j)=(R*T(i,j))/v(i,j);
end
end
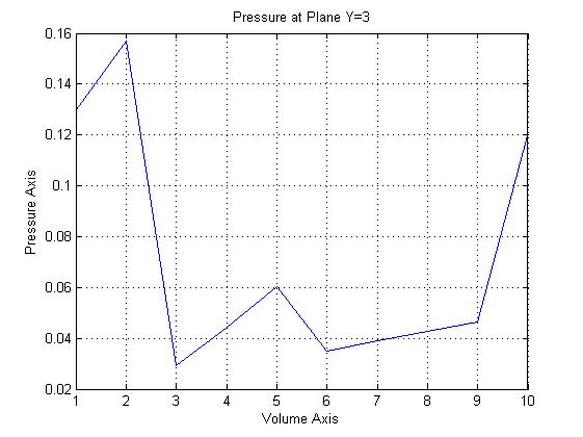
plot(p(:,3))
grid on
figure(1)
xlabel('Volume Axis')
ylabel('Pressure Axis')
Title('Pressure at Plane Y=3')
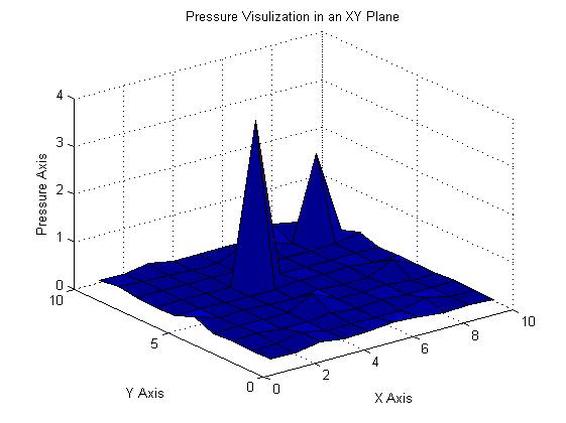
figure(2)
surf(p)
xlabel('X Axis')
ylabel('Y Axis')
Zlabel('Pressure Axis')
Title('Pressure Visulization in an XY Plane')
pause
close all
Unless otherwise noted, all content on this site is @Copyright by Ahmed Al Makky 2012-2013 - http://cfd2012.com

