Harmonic Oscillator
Good link to start from: http://en.wikipedia.org/wiki/Harmonic_oscillator
Studying Harmonic Motion
clc
clear
N=360;
R=12;
r=28;
figure(1)
theta(1)=0;
for i=1:N;
theta(i+1)=theta(i)+1;
alpha(i)=(pi/180)*theta(i+1);
end
for i=1:N;
x0(i)=R*cos(alpha(i));
y0(i)=R*sin(alpha(i));
end
plot(x0,y0)
grid on
hold on
%
% c=0;
% for j=1:2:360;
% c=c+1;
% for i=1:N;
% x(i)=r*cos(alpha(i))+x0(c);
% y(i)=r*sin(alpha(i))+y0(c);
% end
% plot(x,y,'r')
% end
for i=1:5:N
xx=0;
yy=0;
v1=[xx x0(i)]
v2=[yy y0(i)]
f=line(v1,v2)
end
%minimum point
g=20;
gg=0;
plot(g,gg,'*')
%maximum point
g1=20+24;
gg1=0;
plot(g1,gg1,'*')
ll=24/180;
a(1)=20;
for i=1:N-1
a(i+1)=a(i)+ll;
xx(i)=x0(i)+a(i+1);
end
%midpoint
g2=(20+24/2);
gg2=0;
plot(g2,gg2,'*')
v3=[ g2 x0(90)];
v4=[ 0 y0(90)];
f=line(v3,v4)
hold off
figure(2)
plot(x0)
grid on
hold on
for i=1:N;
if (i<=180)
plot(x0(i),'r')
else
plot(x0(i),'*')
end
pause(0.001)
end
xlabel('number of points')
ylabel('Traveled Distance')
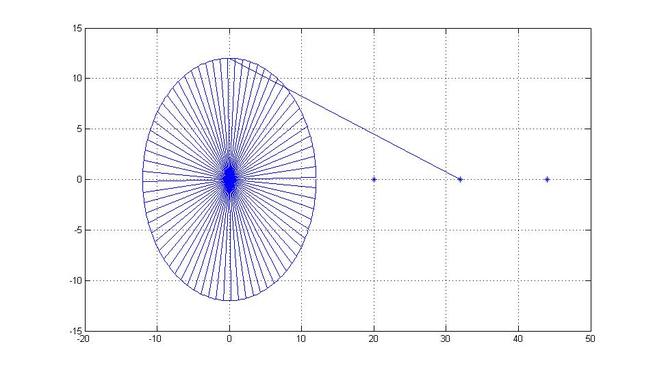
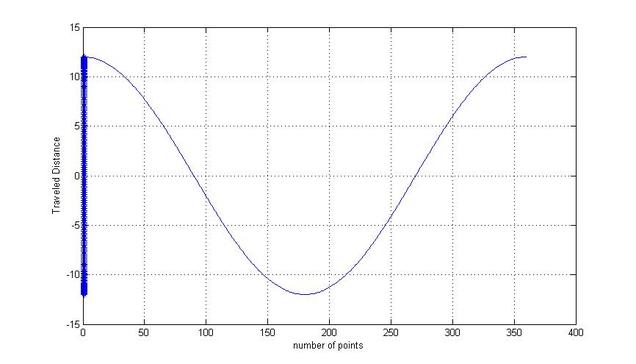
The following figure shows the harmonic motion.
Studying Spring Case
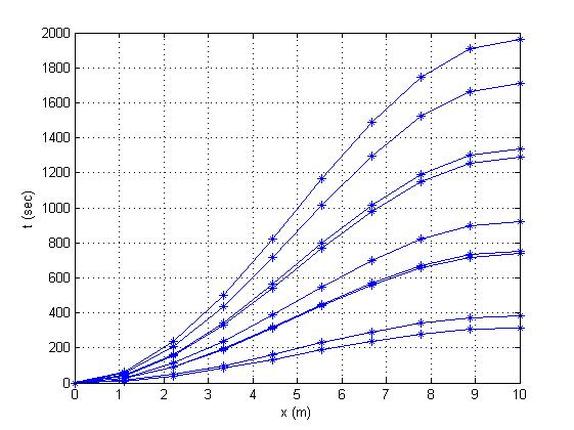
The following code studies a spring of mass and stiffness.
clc
clear
m=10;
M=0.01;
K=1e-3;
for i=1:m;
F(i)=rand(1,1);
eqn2= 'M*D2y+K*y=F(i)';
init2= 'y(0)=0,Dy(0)=1';
y=dsolve(eqn2,init2,'x')
x=linspace(0,10,10);
z=eval(vectorize(y));
plot(x,z,'-*')
xlabel('x (m)')
ylabel('t (sec)')
hold on
end
grid on
figure(2)
plot(F,'-*')
xlabel('t (sec)')
ylabel('F (Newtons) ')
grid on
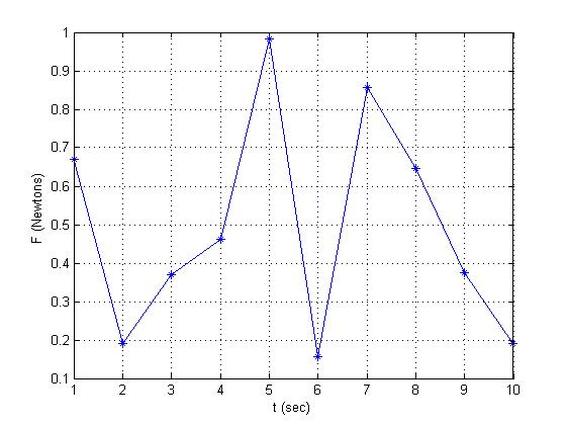
The applied force in relation to time:
Unless otherwise noted, all content on this site is @Copyright by Ahmed Al Makky 2012-2013 - http://cfd2012.com


