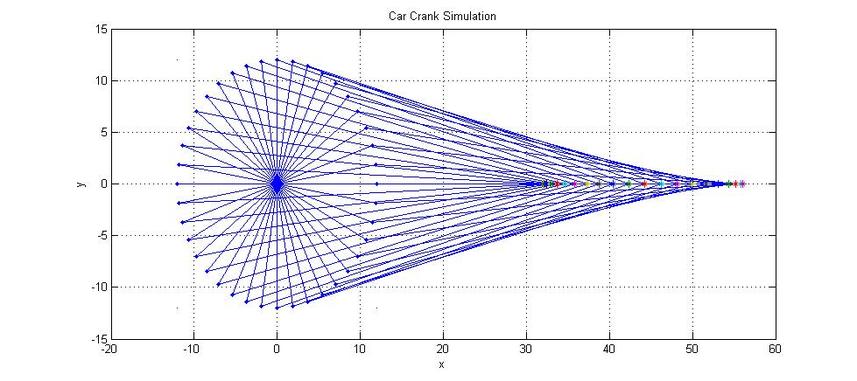
Reciprocating Engine Modelling
clc
clear
N=40;
R=12;
r=44;
%assigning a number to the output figure
figure(1)
% Generating the discrete angles and storing the angles in a matrix to
% retrive the data when ever needed
theta(1)=0;
for i=1:N;
theta(i+1)=theta(i)+9;
alpha(i)=(pi/180)*theta(i+1);
end
% Generating the two dimensional coordinates points, then storing
%the angles in a matrix to retrive the data when ever needed
for i=1:N;
x0(i)=R*cos(alpha(i));
y0(i)=R*sin(alpha(i));
end
%Allocating 4 points in the plotting domain to get the plot in a fixed
%domain , so that i wouldnt change while conducting the do loop.
plot(-12,12);
hold on
plot(-12,-12);
hold on
plot(60,12);
hold on
plot(12,-12);
grid on
title('Car Crank Simulation')
xlabel('x')
ylabel('y')
for i=1:N
plot(x0(i),y0(i),'.');
g=[ 0 x0(i)];
gg=[ 0 y0(i)];
%line linking between the center of coordinates and circual points
f=line(g,gg);
xx(i)=x0(i)+((r)^2-(y0(i)-0)^2)^0.5;
rr=[ x0(i) xx(i)];
rrr=[ y0(i) 0 ];
h=[ rr(2)-rr(1) rrr(2)-rrr(1) ];
%checking using the Phethagourus Therom that the length of the arm is
%constant
check(i)=norm(h);
%line linking between the circual points and piston
ff=line(rr,rrr);
plot(xx,0,'*')
hold on
%Assigning the pause command to an exponential function
tp(i)=exp(-0.001*i);
pause(tp(i))
end
% r=44;
% c=0;
% for j=1:N;
% c=c+1;
% for i=1:N;
% x(i)=r*cos(alpha(i))+x0(c);
% y(i)=r*sin(alpha(i))+y0(c);
% end
% plot(x,y,'r');
% end
% f=line(v3,v4)
% hold off
% figure(2)
% plot(x0)
% grid on
% hold on
% for i=1:N;
% if (i<=180)
% plot(x0(i),'r')
% else
% plot(x0(i),'*')
% end
% pause(0.001)
% end
% xlabel('number of points')
% ylabel('Traveled Distance')
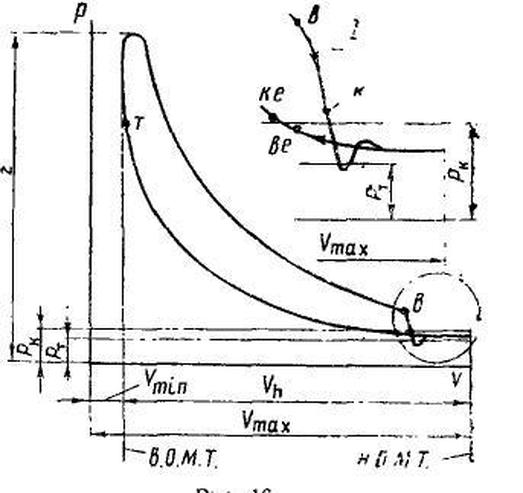
Studying the P-V Diagram of an Engine
Reading the engine data into MATLAB and then converting the data into ..................
Unless otherwise noted, all content on this site is @Copyright by Ahmed Al Makky 2012-2013 - http://cfd2012.com

