Lift Calculation
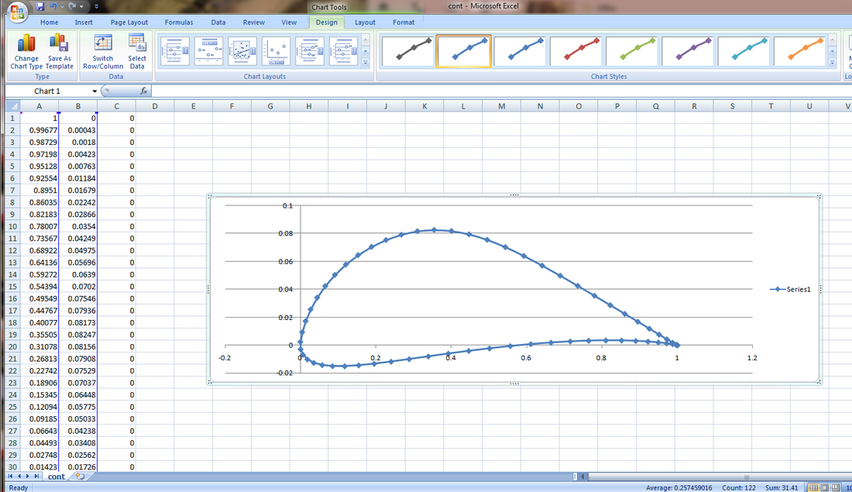
The following mentioned steps show how first to check your given data that it represents an airofoil profile and then reading it into MATLAB.
Reading the data file into Excel
By clicking on the provided image below you can download the Excel file in order to view the airfoil profile:
Airfoil Lift Calculation
The needed file to be downloaded, save it on your desktop, and specify the path when asked by MATLAB to read it from desktop:
| aerofoilprofile.txt | |
| File Size: | 2 kb |
| File Type: | txt |
The following code reads the profile data, then plots the profile points, then links the points together, then calculates the circulation around an airfoil
clc
clear
xx = 'aerofoilprofile.txt'
A = importdata(xx);
nn=size(A)
N=nn(1)
for i=1:N;
x(i)=A(i,2);
end
for i=1:N;
y(i)=A(i,1);
end
plot(y,x)
grid on
hold on
axis equal
for i=1:N;
h=plot(y(i),x(i),'*r');
pause(0.1)
set(h,'EraseMode','xor','MarkerSize',13);
end
x0=0;
y0=0;
title('Vector Analysis')
xlabel('x')
ylabel('y')
for i=1:N-1;
v1=[ x0 x(i)];
v2=[ y0 y(i)];
v3=[ x(i+1) x(i)];
v4=[ y(i+1) y(i)];
v5=[ x0 x(i+1)];
v6=[ y0 y(i+1)];
plot(y(i),x(i),'^')
r2=line(v6,v5);
dr=line(v4,v3);
r1=line(v2,v1);
pause(0.1)
end
%Calculation of Path
x0=0;
y0=0;
x00=0;
y00=0;
for i=1:N;
e=0;
ee=0;
eee=0;
if (i==1)
ee=i;
a(ee)= x(ee)-x0 ;
b(ee)= y(ee)-y0 ;
aa=[a(ee) b(ee)];
c(ee)=norm(aa);
elseif (i>1) & (i<N-1)
e=i;
a(e)=x(e+1)-x(e) ;
b(e)=y(e+1)-y(e) ;
aaa=[a(e) b(e)];
c(e)=norm(aaa);
elseif (i==N)
eee=i;
a(eee)=x(eee)-x0;
b(eee)=y(eee)-y0;
aaaa=[a(eee) b(eee)];
c(eee)=norm(aaaa);
end
end
Traveled_Distance=sum(c)
density=1.29;
for i=1:10
velocity(i)=10*i;
Liftforce(i)=Traveled_Distance*density*velocity(i);
end
figure(2)
plot(velocity,Liftforce)
grid on
axis equal
xlabel('Flow Velocity (m/s)')
ylabel('Lift Force (N/m2)')
Code Generated Output
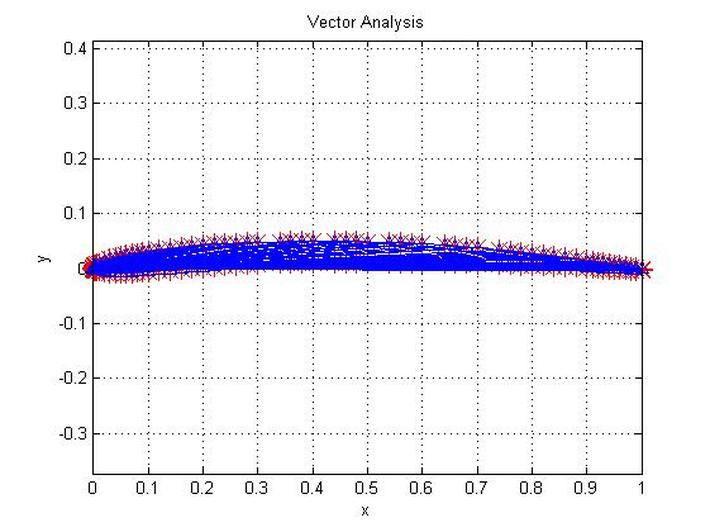
The plotted profile points are shown in red, when circulation is calculated using the Lagrangian method, ithe process is represented in blue lines studied in relation to a fixed point.
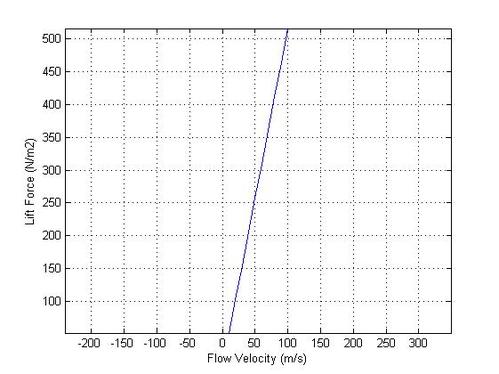
The relationship between lift and speed of airflow.
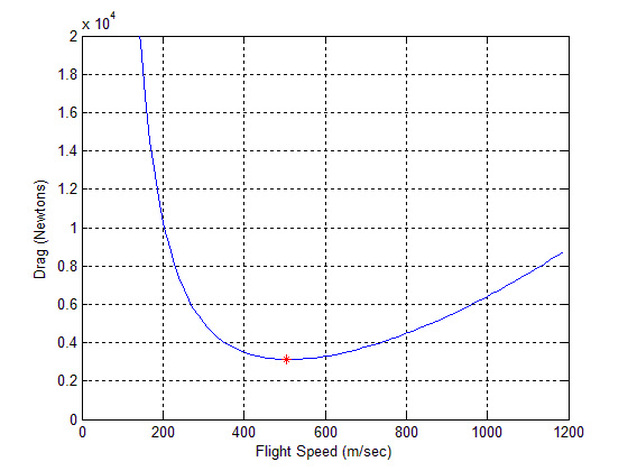
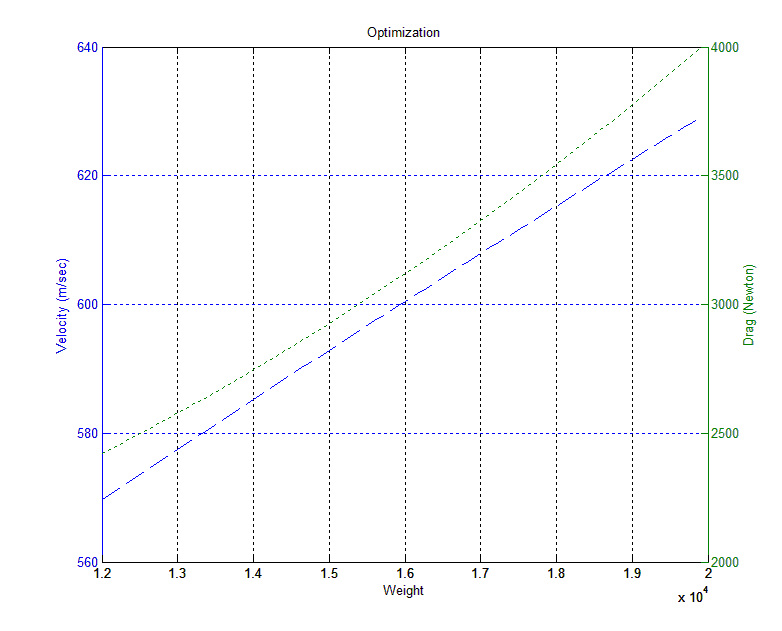
The Total Drag Calculation on an Airfoil
clc
clear
%sqma=ratio of air density between the flight altitude and sea level
M=100;
sqma=0.6;
V(1)=0;
V(M)=1200;
DV=(V(M)-V(1))/M
V=[V(1):DV:V(M)];
W=16000;
for i=1:M;
D(i)=0.01*sqma*(V(i)^2)+(0.95/sqma)*(W/V(i))^2;
end
plot(V(1:M),D(1:M))
grid on
xlabel('Flight Speed (m/sec)')
ylabel('Drag (Newtons)')
axis([0 1200 0 20000])
minimumDrag=min(D(:))
c=0;
for i=1:M;
c=c+1;
if D(i) == minimumDrag
h=c
end
end
Velocityatminumimdrag=V(h)
hold on
plot(V(h),D(h),'r*')
figure(2)
M=100;
sqma=0.6;
W(1)=12000;
W(M)=20000;
DW=(W(M)-W(1))/M;
W=[W(1):DW:W(M)];
for i=1:M;
V(i)=Velocityatminumimdrag;
DD(i)=0.01*sqma*(V(i)^2)+(0.95/sqma)*(W(i)/V(i))^2;
end
VVV(1)=450;
VVV(M)=550;
DV=(VVV(M)-VVV(1))/M
VVV=[VVV(1):DV:VVV(M)];
for i=1:M;
D(i)=minimumDrag;
a=0.01*sqma
b=(0.95/sqma)
VV(i)=((1/a)*(D(i)*(VVV(i))^2-b*W(i)))^0.25
end
[AX,H1,H2] = plotyy(W(1:M),VV(1:M),W(1:M),DD(1:M),'plot');
set(get(AX(1),'Ylabel'),'String','Velocity (m/sec)')
set(get(AX(2),'Ylabel'),'String','Drag (Newton)')
xlabel('Weight')
title('Optimization')
set(H1,'LineStyle','--')
set(H2,'LineStyle',':')
grid on
Unless otherwise noted, all content on this site is @Copyright by Ahmed Al Makky 2012-2013 - http://cfd2012.com
