Example Dealing with Vectors.
x=[ 1 2 ]
y=[ 4 5]
x'
A good link : http://www.cyclismo.org/tutorial/matlab/vector.html
y=[ 4 5]
x'
A good link : http://www.cyclismo.org/tutorial/matlab/vector.html
Example Working with Vector Fields
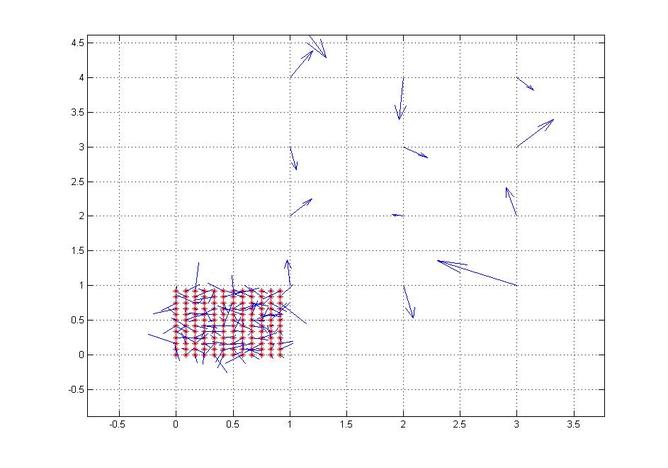
Plotting vector fileds is some thing that you need to know in CFD. The following links and examples contribute to increasing the students view about vector fields.
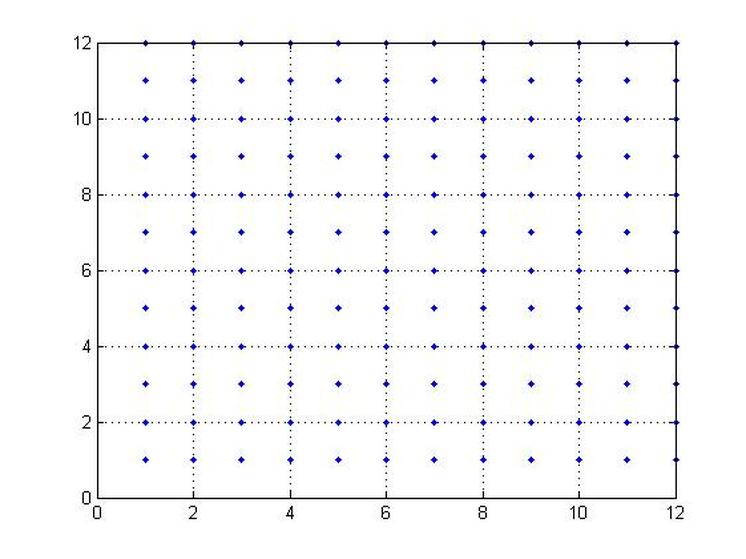
Assigning a Vector Field to a 2D Plane
clc
clear
LX=1
LY=1
N=12
M=12
DX=LX/N
DY=LY/M f
or I=1:N
for J=1:M
A(I,J)=0; end
end for I=1:N
for J=1:M
plot (I,J,'.')
hold on
grid on
end
end
clear
LX=1
LY=1
N=12
M=12
DX=LX/N
DY=LY/M f
or I=1:N
for J=1:M
A(I,J)=0; end
end for I=1:N
for J=1:M
plot (I,J,'.')
hold on
grid on
end
end
Assigning a Vector Field to a Square Inflow Plane
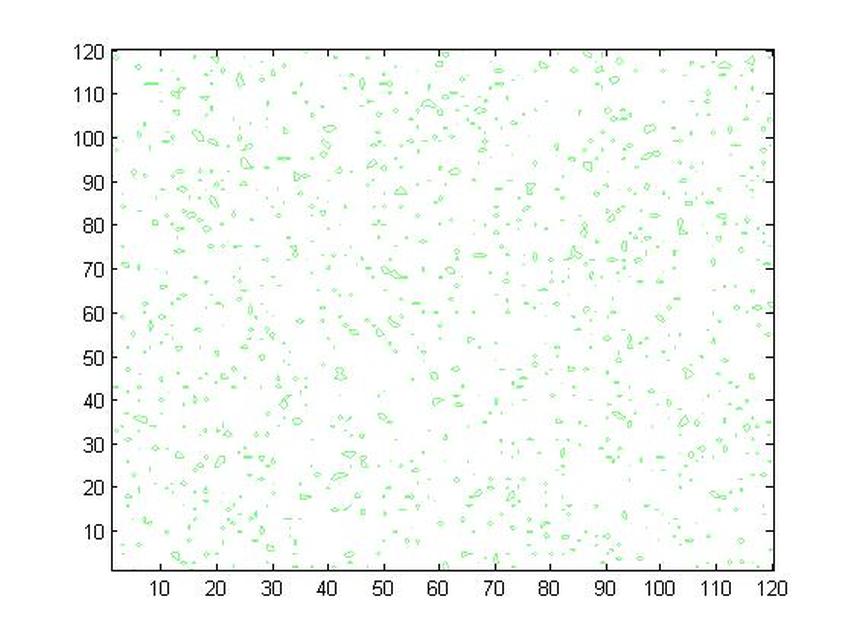
The main purpuse of this is to write a two dimensional function which replicates the inflow parameters of a studied domain. Several functions will be used with the emphesas on a couple of important commands such as Meshgrid and camlight, zoom, etc..
clc
clear
LX=1
LY=1
N=120
M=120
DX=LX/N
DY=LY/M
for I=1:N
for J=1:M
v(I,J)=randn(1,1);
end
end
contour(v(1:120,1:120),-1.3,'DisplayName','v(1:120,1:120)');
figure(gcf)
%for I=1:N
%for J=1:M
%plot (I,J,'.R')
%hold on %plot (I,1:N,'.r')
%hold on
%plot (J,1:M,'--r')
%hold on
%grid on
%end
%end
clear
LX=1
LY=1
N=120
M=120
DX=LX/N
DY=LY/M
for I=1:N
for J=1:M
v(I,J)=randn(1,1);
end
end
contour(v(1:120,1:120),-1.3,'DisplayName','v(1:120,1:120)');
figure(gcf)
%for I=1:N
%for J=1:M
%plot (I,J,'.R')
%hold on %plot (I,1:N,'.r')
%hold on
%plot (J,1:M,'--r')
%hold on
%grid on
%end
%end
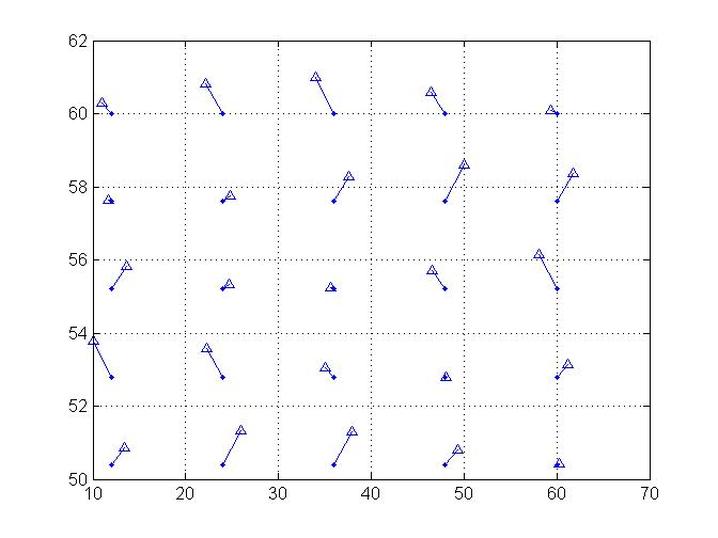
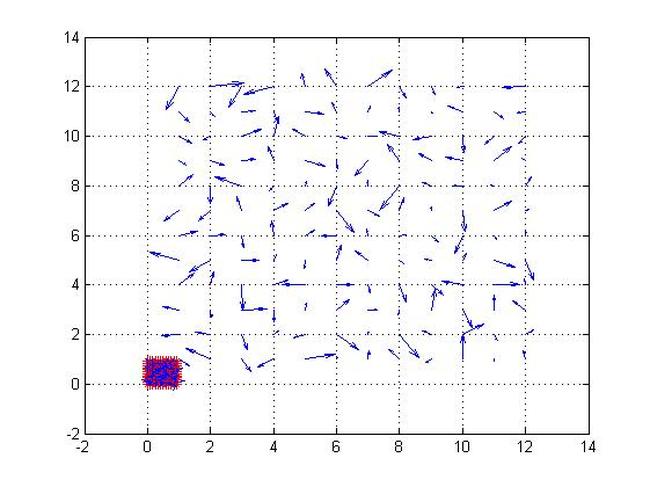
Example Steady Vector Field Plotting
%Vector Field Ploting
clc
clear
%Number of Mesh Points
N=5;
M=5;
%Domain Dimensions
Lx=12;
Ly=12;
dx=Lx/N;
dy=Ly/M;
q=0;
a=0;
b=0;
for i=1:N;
for j=1:M;
a=a+1;
b=b+1;
%Generation of Grid Points
x(i)=a*dx;
y(j)=b*dy;
%Velocity Field Components
u(i,j)=sin(x(i))+sin(y(j));
v(i,j)=sin(x(i))*sin(y(j));
Vec=[ u(i,j) v(i,j) ];
ratio=v(i,j)/u(i,j);
% Calculation of the Velocity Vector Inclenation Angle
theta(i,j)=atan(ratio);
% Calculation of the Velocity Vector Norm
V(i,j)=norm(Vec);
% Assigning the calculated values to be stored in Vector Matrix
t=V(i,j);
tt=theta(i,j);
ttt=u(i);
tttt=v(i);
ttttt=x(i);
tttttt=y(i);
q=q+1;
Vector(q,1:7)=[ q t tt ttt tttt ttttt tttttt];
end
end
for i=1:N
for j=1:M
%Plotting the Grid Points
plot (x(i),y(j),'.')
hold on
grid on
xx(i)=x(i)+u(i,j);
yy(j)=y(j)+v(i,j);
nm=[ x(i) xx(i) ];
mn=[ y(j) yy(j) ];
%Line Connecting the Coordinate Points of the Vector
f=line(nm,mn);
%Plotting the Vector Tip Points
plot(xx(i),yy(j),'^')
end
end
Vector
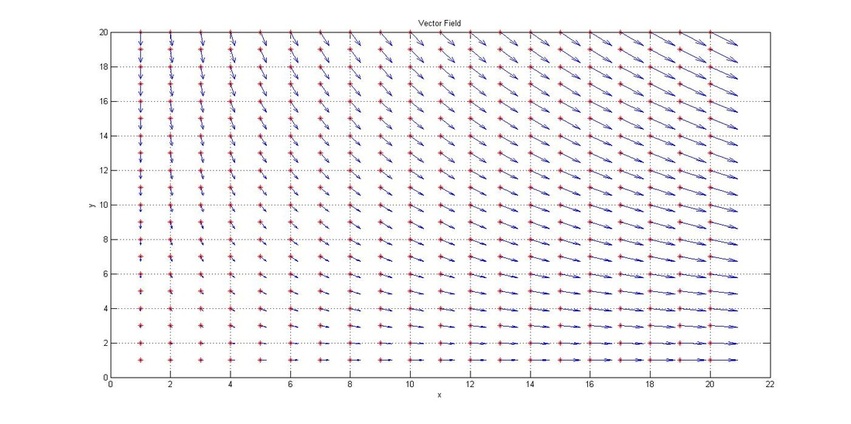
Example
clc
clear
M=20;
N=20;
LX=1;
LY=1;
dx=LX/M;
dy=LY/N;
aa=-1;
for i=1:M;
aa=aa+1;
x(i)=aa*dx;
end
figure('Position',[20 20 1400 700])
aa=-1;
for j=1:N;
aa=aa+1;
y(j)=aa*dy;
end
for i=1:M;
for j=1:N;
plot(i,j,'*r');
hold on
end
end
for i=1:M;
for j=1:N;
u(i,j)=y(j);
end
end
for i=1:M;
for j=1:N;
v(i,j)=-sin(x(i));
end
end
grid on
xlabel('x');
ylabel('y')
title('Vector Field')
set(gca,'XLim',[0 M+2],'YLim',[0 N])
quiver(u,v)
Making a Movie and Time Stepping
Code is still in construction stage.
clc
clear
M=100;
N=100;
L=2;
x0=0;
xl=x0+L;
dx=L/M;
dy=L/N;
a=0.23;
tt=10;
for t=1:tt;
a=a+0.01;
for j=1:N;
for i=1:M;
x(i,j,t)=i*dx;
y(i,j,t)=j*dy;
yy(i,j,t)=1000*sin(pi*x(i,j))*(a*x(i,j))^2;
end
end
end
for t=1:tt;
image(yy(:,:,t))
xlabel('x')
ylabel('y')
title('Movie')
MM(t)=getframe
end
frame_order = [1:tt 1:1:tt];
number_repeats = 4;
movie(MM, [number_repeats frame_order]);
map = hsv(16);
colorbar
Playing Around with the Scale of the Vector Field
clc
clear
M=12;
N=12;
LX=1;
LY=1;
dx=LX/M;
dy=LY/N;
%studied case
dA2=dx*dy;
%Referance case
dA1=1;
%Mesh Generation
aa=-1;
for i=1:M;
aa=aa+1;
x(i)=aa*dx;
end
aa=-1;
for j=1:N;
aa=aa+1;
y(j)=aa*dy;
end
for i=1:M;
for j=1:N;
plot(x(i),y(j),'*r');
hold on
end
end
%Assigning Scalar Quantities
for i=1:M;
for j=1:N;
u(i,j)=randn(1,1);
end
end
for i=1:M;
for j=1:N;
v(i,j)=randn(1,1);
end
end
d11=max(u);
dd1=max(d11);
d22=max(v);
dd2=max(d22);
grid on
%
% for i=1:M;
% for j=1:N;
% d1(i,j)=dd1;
% s1(i,j)=u(i,j)/d1(i,j);
% d2(i,j)=dd2;
% s2(i,j)=v(i,j)/d2(i,j);
% end
% end
%
% ss1=min(s1);
% alpha1=min(ss1);
% ss2=min(s2);
% alpha2=min(ss2);
alpha1=0.1;
alpha2=0.1;
for i=1:M;
for j=1:N;
V1=[ x(i) (alpha1*u(i,j)+x(i)) ];
V2=[ y(j) (alpha2*v(i,j)+y(j)) ];
f=line(V1,V2);
end
end
quiver(u,v)
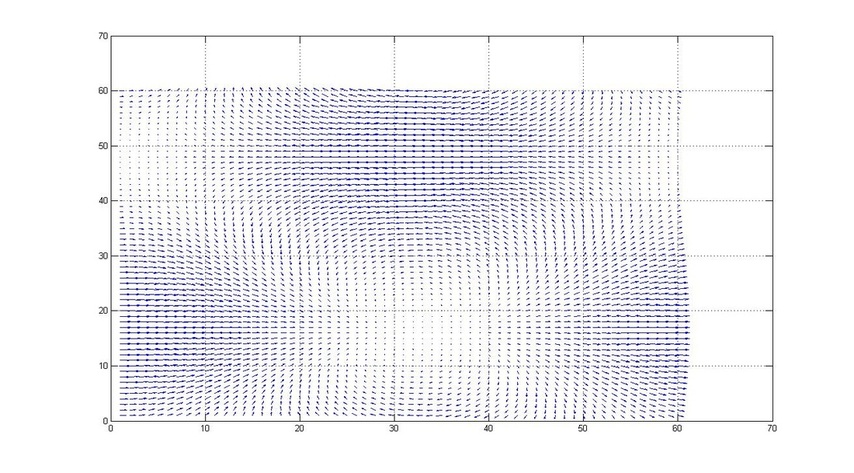
High Detailed Vector Field Study
clc
clear
M=60;
N=60;
LX=6;
LY=6;
dx=LX/M;
dy=LY/N;
%studied case
dA2=dx*dy;
%Referance case
dA1=1;
%Mesh Generation
aa=-1;
for i=1:M;
aa=aa+1;
x(i)=aa*dx;
end
aa=-1;
for j=1:N;
aa=aa+1;
y(j)=aa*dy;
end
%
% for i=1:M;
% for j=1:N;
% plot(x(i),y(j),'*r');
% hold on
% end
% end
%Assigning Scalar Quantities
for i=1:M;
for j=1:N;
u(i,j)=sin(x(i))+cos(y(j));
end
end
for i=1:M;
for j=1:N;
v(i,j)=sin(y(j))*cos(x(i));
end
end
% d11=max(u);
% dd1=max(d11);
% d22=max(v);
% dd2=max(d22);
% grid on
% %
% % for i=1:M;
% % for j=1:N;
% % d1(i,j)=dd1;
% % s1(i,j)=u(i,j)/d1(i,j);
% % d2(i,j)=dd2;
% % s2(i,j)=v(i,j)/d2(i,j);
% % end
% % end
% %
% % ss1=min(s1);
% % alpha1=min(ss1);
% % ss2=min(s2);
% % alpha2=min(ss2);
% alpha1=0.1;
% alpha2=0.1;
% for i=1:M;
% for j=1:N;
% V1=[ x(i) (alpha1*u(i,j)+x(i)) ];
% V2=[ y(j) (alpha2*v(i,j)+y(j)) ];
% f=line(V1,V2);
% end
% end
quiver(u,v)
grid on
3D Vector Fields
clc
clear
M=5;
N=5;
LX=1;
LY=1;
dx=LX/M;
dy=LY/N;
aa=-1;
for i=1:M;
aa=aa+1;
x(i)=aa*dx;
end
figure(1)
aa=-1;
for j=1:N;
aa=aa+1;
y(j)=aa*dy;
end
set(1, 'units', 'centimeters', 'pos', [0 0 20 10])
for i=1:M;
for j=1:N;
plot(i,j,'*r');
hold on
end
end
axis equal
for i=1:M;
for j=1:N;
u(i,j)=y(j);
end
end
for i=1:M;
for j=1:N;
v(i,j)=-sin(x(i));
end
end
grid on
xlabel('x');
ylabel('y')
title('Vector Field')
quiver(u,v)
figure(2)
[u,v]=meshgrid(10:dx:20,10:dy:20);
w=u+v;
[C,h] = contour(u,v,w,10);
set(h,'ShowText','on','TextStep',get(h,'LevelStep')*2)
colormap cool
grid on
axis equal
figure(3)
[x,y] = meshgrid(10:dx:20,10:dy:20);
z = x.* exp(-x.^2 - y.^2);
[u,v,w] = surfnorm(x,y,z);
quiver3(x,y,z,u,v,w);
% hold on
% surf(x,y,z);
% colormap hsv
% view(-35,45)
% axis equal %([-2 2 -1 1 -.6 .6])
% hold off
Unless otherwise noted, all content on this site is @Copyright by Ahmed Al Makky 2012-2013 - http://cfd2012.com
