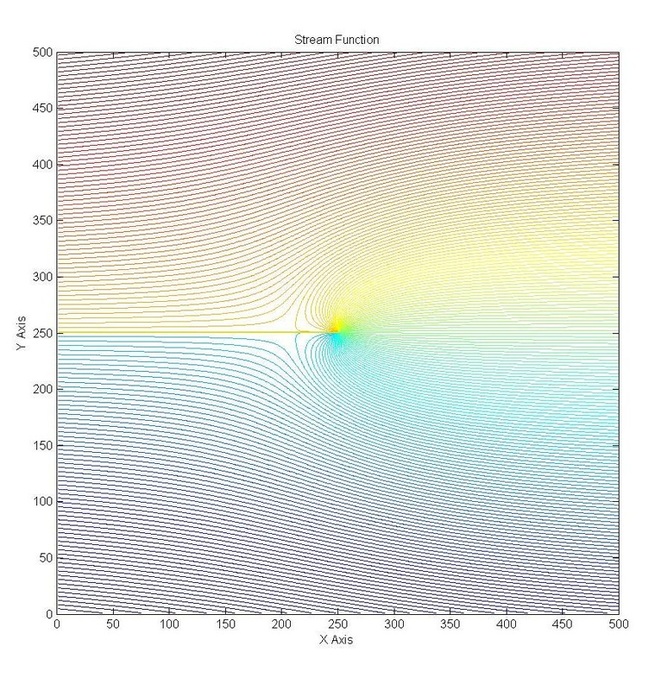
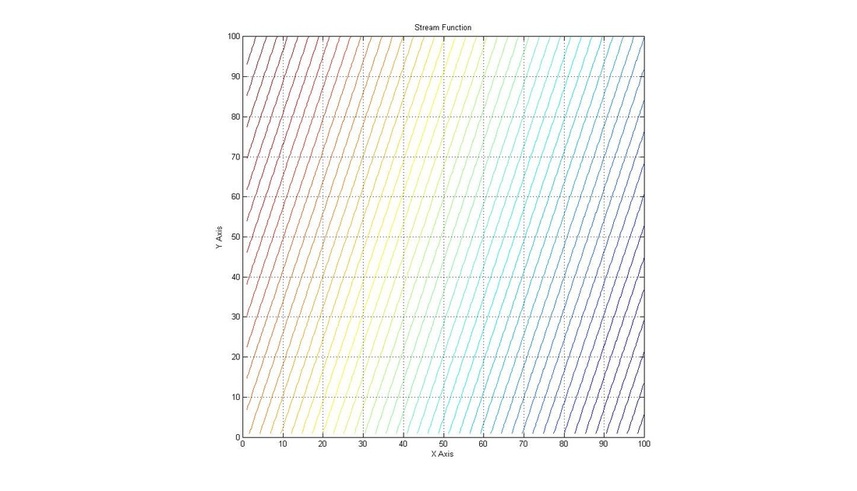
Example Plotting a Stream Function for an Ideal Flow
clc
clear
NGRIDPOINTS=500;
Contour_density=200;
xx0=-1;
xx=1;
dx=(xx-xx0)/(NGRIDPOINTS);
X=xx0:dx:xx;
Y=X;
[x,y]=meshgrid(X,Y);
Q=1;
UINF=1;
VINF=0;
Z=+UINF*y-VINF*x+Q/(2*pi)*atan2(y,x);
figure('Position',[10 10 1700 900])
contour(Z,Contour_density);
axis equal
title('Stream Function')
xlabel('X Axis')
ylabel('Y Axis')
set(gca,'XLim',[0 NGRIDPOINTS],'YLim',[0 NGRIDPOINTS])
Coding Stream Functions
clc
clear
% X=-1:.1:1;
% Y=X;
% [x,y]=meshgrid(X,Y);
Q=1;
UINF=1.;
VINF=0.;
L=10;
M=10;
N=1;
LX=1;
LY=1;
DX=LX/L;
DY=LY/M;
for i=1:L
for j=1:M;
for k=1:N
x(i,j,k)=i*DX;
y(i,j,k)=j*DY;
end
end
end
for i=1:L
for j=1:M;
for k=1:N
z(i,j,k)=+UINF*y(i,j,k)-VINF*x(i,j,k)+Q/(2.*3.14158)*atan2(y(i,j,k),x(i,j,k));
end
end
end
% for i=1:L;
% for j=1:M
plot(x(:,1,1),z(1:10,6,1));
axis equal
% hold on
grid on
% end
% pause(0.1)
% hold off
% end
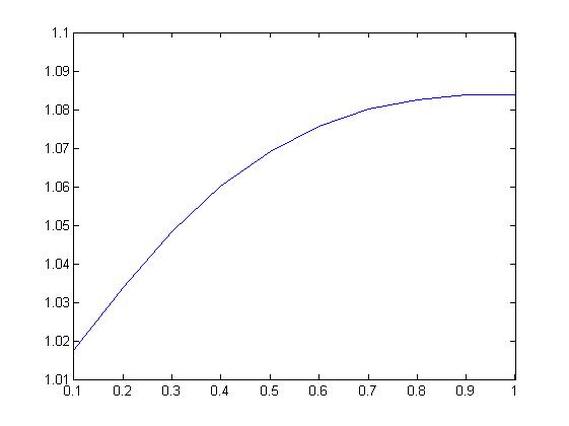
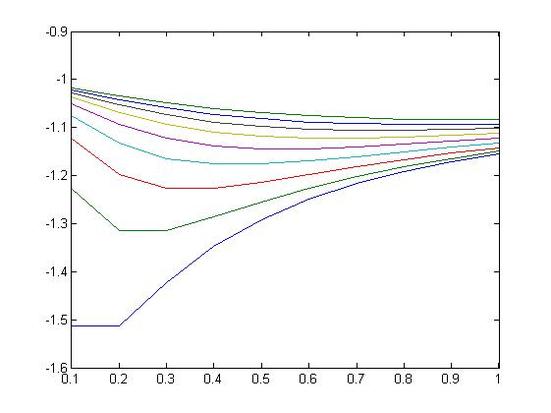
for j=1:9;
for k=1:N
U(1:10,j,k)=(z(1:10,j+1,k)-z(1:10,j,k))/DY
V(1:10,j,k)=-(z(1:10,j+1,k)-z(1:10,j,k))/DX
end
end
plot(x(1:10),U(1:10,9,1))
pause(1)
plot(x(1:10),V)
% contour(z,20);
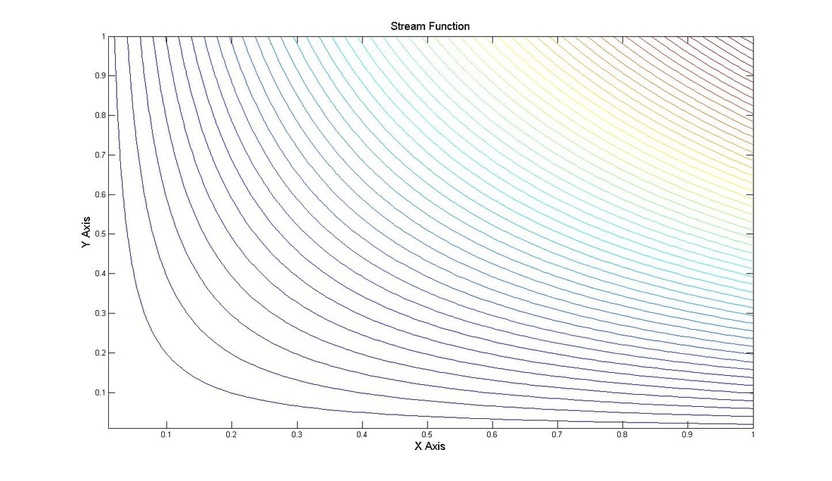
clc
clear
NGRIDPOINTS=100;
Contour_density=50;
xx0=0;
xx=1;
dx=(xx-xx0)/(NGRIDPOINTS);
ii=xx0;
for i=1:NGRIDPOINTS;
ii=ii+1;
jj=xx0;
for j=1:NGRIDPOINTS;
jj=jj+1;
X(i,j)=ii*dx;
Y(i,j)=jj*dx;
end
end
for i=1:NGRIDPOINTS;
for j=1:NGRIDPOINTS;
Z(i,j)=X(i,j)*Y(i,j);
end
end
figure('Position',[10 10 1700 900])
[C,h] = contour(X(:,:),Y(:,:),Z(:,:),Contour_density);
%clabel(C,h);
%axis equal
title('Stream Function','FontSize',14)
xlabel('X Axis','FontSize',14)
ylabel('Y Axis','FontSize',14)
set(gca,'XLim',[0 xx0],'YLim',[0 xx0])
Example
clc
clear
NGRIDPOINTS=100;
Contour_density=50;
xx0=-1;
xx=1;
dx=(xx-xx0)/(NGRIDPOINTS);
X=xx0:dx:xx;
Y=X;
[x,y]=meshgrid(X,Y);
Q=0;
UINF=1;
VINF=3;
Z=+UINF*y-VINF*x+Q/(2*pi)*atan2(y,x);
figure('Position',[10 10 1700 900])
contour(Z,Contour_density);
axis equal
title('Stream Function')
xlabel('X Axis')
ylabel('Y Axis')
set(gca,'XLim',[0 NGRIDPOINTS],'YLim',[0 NGRIDPOINTS])
hold on
plot(x(50,29),y(50,29),'*')
hold on
plot(x(50,30),y(50,30),'*')
f1=line(x(50,30)-x(50,29),y(50,30)-y(50,29))
hold on
plot(x(50,29),y(50,29),'+')
hold on
plot(x(51,29),y(51,29),'+')
f2=line(x(51,29)-x(50,29),y(51,29)-y(50,29))
f=line(x(51,29)-x(50,29),y(51,29)-y(50,29))
u=-(Z(50,30)-Z(50,29))/dx
v=(Z(30,50)-Z(29,50))/dx
grid on
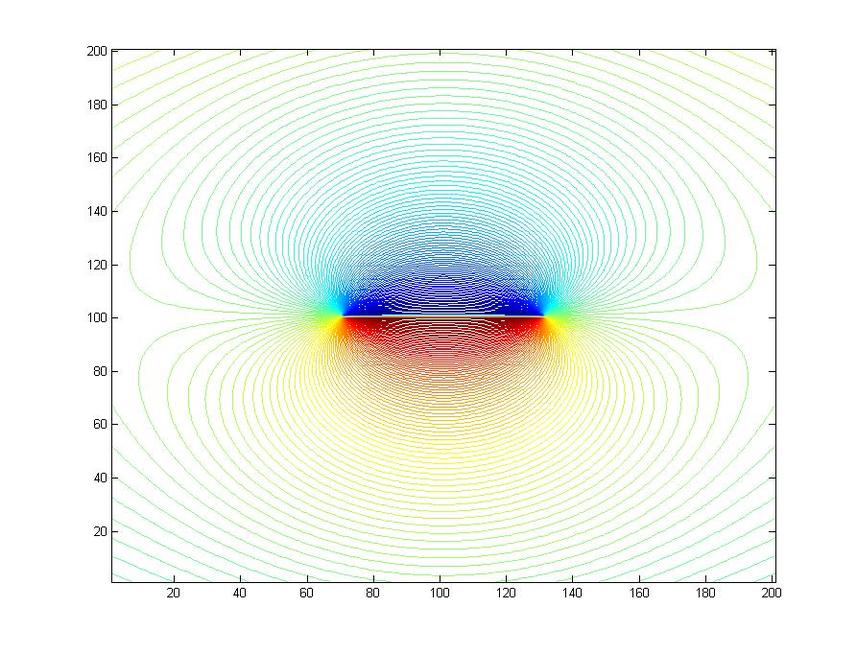
Example
clc
clear
X=-1:0.01:1;
Y=X;
[x,y]=meshgrid(X,Y);
Q=10;
UINF=1.;
VINF=0.;
z=Q/(2.*3.14158)*atan2(y,x+.3)-Q/(2.*3.14158)*atan2(y,x-.3)+UINF*y-VINF*x;
contour(z,150);
clear
X=-1:0.01:1;
Y=X;
[x,y]=meshgrid(X,Y);
Q=10;
UINF=1.;
VINF=0.;
z=Q/(2.*3.14158)*atan2(y,x+.3)-Q/(2.*3.14158)*atan2(y,x-.3)+UINF*y-VINF*x;
contour(z,150);
Recommended Link:
Unless otherwise noted, all content on this site is @Copyright by Ahmed Al Makky 2012-2013 - http://cfd2012.com
