Examples of Coding Equations
Example Simulating Mass Diffusion of Air and CH4
clc
clear
KB=1.380658*10^(-23);
M=100;
dx=1;
dy=1;
dz=1;
VV=dx*dy*dz;
AVGADO=6.022*10^23;
P=1.01*10^(5);
RA=0.7;
RB=0.3;
PA=RA*P;
PB=RB*P;
% B=CH4(3.758) + A=AIR(3.711) OR CO2 + AIR
% pV = nRT ;
% T=31+273=304K
% p=1.4*1.01*10^5
% V= 1m^3
% n= 1.4*1.01*10^5*1/8.314*304=55.95moles
% 1 mole contains 6.022*10^23 molecules
% So result 3.369*10^25molecules
% 2) in 1.8m^3 there are in moles 55.95*1.8=100.8moles
% and so 25.2 moles of O2 and 75.6 moles of N2
% mass of O2 25.2*32=806g
% mass of N2 75.6*28=2117g
a=29;
b=44;
for i=1:M
MAAAA(i)=a;
MBBBB(i)=b;
MAA(i)=806;
MBB(i)=2117;
MAAA(i)=MAA(i)/MAAAA(i);
MBBB(i)=MBB(i)/MBBBB(i);
NA(i)=MAAA(i)/RA;
NB(i)=MBBB(i)/RB;
end
for i=1:M
PP(i)=PA;
TT(i)=273+20;
V(i)=VV;
R(i)=8.314;
NMOLES(i)=(PP(i)*V(i))/(R(i)*TT(i));
TOT_NMOLES(i)=NMOLES(i)*AVGADO;
end
SEKMAA=3.711;
SEKMAB=3.758;
SKMA=0.5*(SEKMAA+SEKMAB);
for i=1:M;
T(i)=273+0.00001*randn(1,1);
P(i)=1.01*10^5;
MA(i)=28.97;
NA(i)=1;
VAVG(i)=(8*KB*T(i)/(pi*MA(i)))^(0.5);
ZA(i)=0.25*(TOT_NMOLES(i)/V(i))*VAVG(i);
LAMDA(i)=(((2)^(0.5))*pi*(TOT_NMOLES(i)/V(i))*(SKMA)^2)^(-1);
DAB(i)=(2/3)*((((KB)^3)*T(i)/((pi^3)*MA(i)))^0.5)*(T(i)/(((SKMA)^2)*P(i)));
end
scrsz = get(0,'ScreenSize');
figure('Position',[200 200 1500 700])
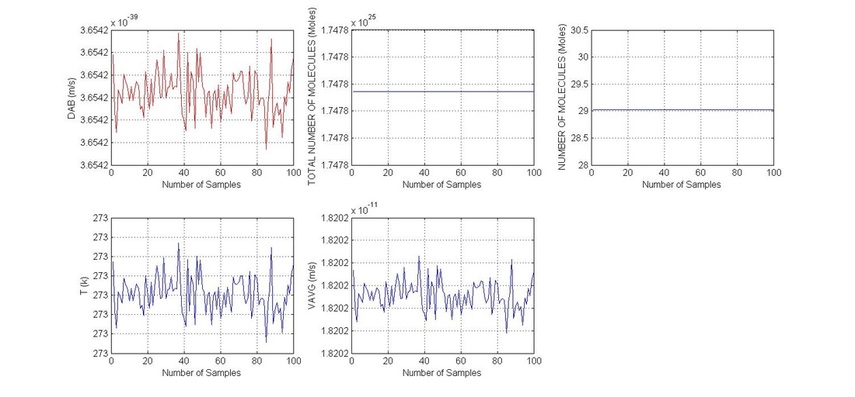
subplot 231
plot(DAB,'r')
Xlabel('Number of Samples')
ylabel('DAB (m/s)')
grid on
subplot 232
plot(TOT_NMOLES)
Xlabel('Number of Samples')
ylabel('TOTAL NUMBER OF MOLECULES (Moles)')
grid on
subplot 233
plot(NMOLES)
Xlabel('Number of Samples')
ylabel('NUMBER OF MOLECULES (Moles)')
grid on
subplot 234
plot(T)
Xlabel('Number of Samples')
ylabel('T (k)')
grid on
subplot 235
plot(VAVG)
Xlabel('Number of Samples')
ylabel('VAVG (m/s)')
grid on
pause(10)
close all
Example Redlich-Kwong Equation
% Redlich–Kwong Equation of State for Argon
clc
clear
N=10;
%constants section
for i=1:N;
R(i)=8314;
TC(i)=150.7;
pc(i)=4870;
v(i)=0.001;
n(i)=1;
Vm(i)=v(i)/n(i);
end
%Generating Temperature Data
T(1)=273.15;
for i=1:N-1;
T(i+1)=T(i)+1;
end
%Algebric operations for the two formulas
for i=1:N;
aa(i)=(R(i))^2;
aaa(i)=(TC(i))^(5/2);
aaaa(i)=(aa(i)*aaa(i))/pc(i);
a(i)=0.4275*aaaa(i);
bb(i)=R(i)*TC(i);
bbb(i)=bb(i)/pc(i);
b(i)=0.08664*bbb(i);
end
%Algebric operations for the Redlich formula
for i=1:N;
ccc(i)=Vm(i)-b(i);
cc(i)=R(i)*T(i);
c(i)=cc(i)/ccc(i);
dddd(i)=(T(i))^(0.5);
ddd(i)=Vm(i)*(Vm(i)+b(i));
dd(i)=ddd(i)*dddd(i);
d(i)=a(i)/dd(i);
p(i)=c(i)-d(i);
e(i)=0.5*(T(i)/TC(i));
ee(i)=p(i)/pc(i);
if (ee(i)<e(i))
display('It Satisfies the adequate Condition ')
else
display('It dose not Satisfie the adequate Condition ')
end
end
%Storing the data into a matrix
xx=0;
for i=1:N;
for j=1:3;
xx=xx+1;
if (j==1)
A(i,j)=xx;
elseif (j==2)
A(i,j)=T(i);
elseif (j==3)
A(i,j)=p(i);
end
end
end
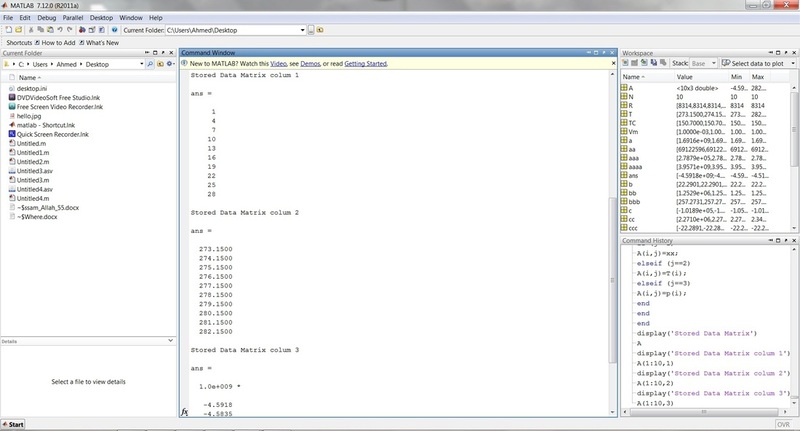
display('Stored Data Matrix')
A
display('Stored Data Matrix colum 1')
A(1:10,1)
display('Stored Data Matrix colum 2')
A(1:10,2)
display('Stored Data Matrix colum 3')
A(1:10,3)
Example Studying The Diffusion of CO2 in Relation to Temperature
clc
clear
%Studying the diffusion case for a CO2
%Selecting 100 points
N=100;
%The discrete temeperature difference
delat_t=0.1;
%Referance Temperature
T(1)=300;
%Data Generation Loop
for i=1:N-1;
T(i+1)=T(i)+delat_t;
R(i)=8.314;
%j/mole.kelvin
EA(i)=160000;
%j/mole
b(i)=R(i)*T(i+1);
a(i)=EA(i)/b(i);
D0(i)=16;
%*(0.001)^2;
D(i)=D0(i)*exp(-a(i));
end
%Data Plotting Section
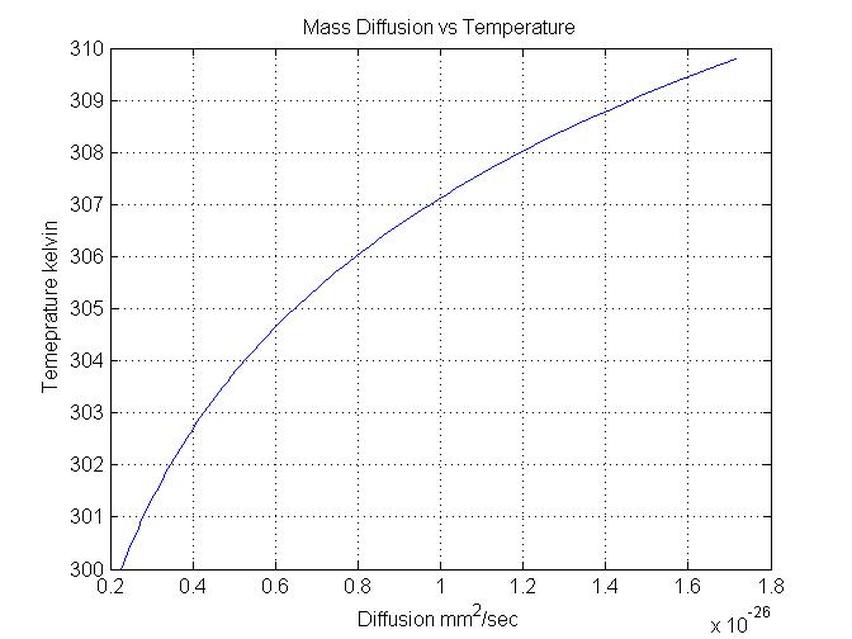
plot(D(1:N-1),T(1:N-1))
figure(1)
title('Mass Diffusion vs Temperature')
xlabel('Diffusion mm^2/sec')
ylabel('Temeprature kelvin')
grid on
Example Sutherland Equation
Needed skills: To get a formula to generate data. Dissecting the formula into variables.
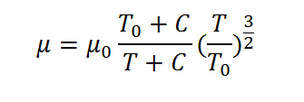
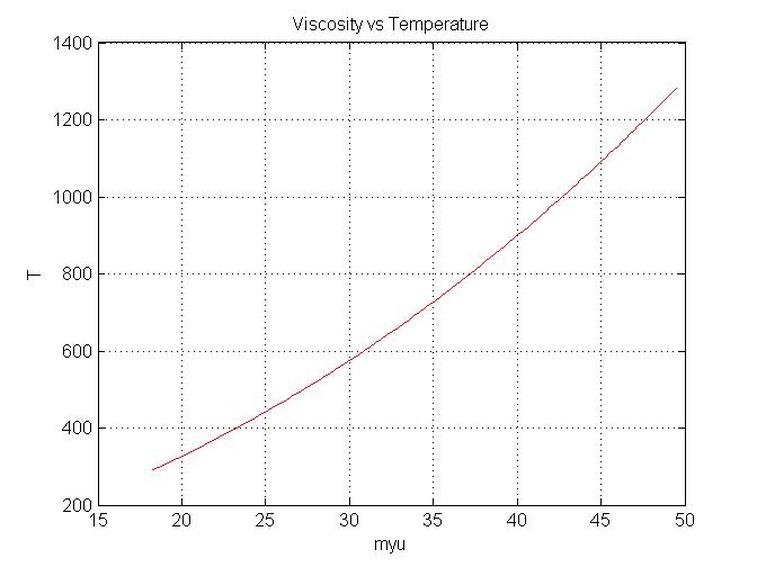
Choosing the input variables which are constructed by an n dimension matrix depending on how many variables it depends on. Logically the data generated is from the left hand side of the formula, so that’s a one dimensional matrix. What is changing is the temperature on the left hand side of the formula, so that means we will have a one-dimensional matrix as a result from the calculation. On the right-hand side of the formula we have several constants which are C, T0 and myu zero.
Next comes the construction of the left hand side matrices, once the word matrix is mentioned that means dimensions which refers to how many points do we want to take. We have three matrices to construct. Next comes the merging process of different algebraic operations. Next comes the data output generated from the studied formula
Next comes the construction of the left hand side matrices, once the word matrix is mentioned that means dimensions which refers to how many points do we want to take. We have three matrices to construct. Next comes the merging process of different algebraic operations. Next comes the data output generated from the studied formula
% For an air studied problem
clc
clear
N=100;
%Assigning values for the Constants
for i=1:N;
T0(i)=291.15;
C(i)=120;
myu0(i)=18.27;
end
% Generating a set of temperature Data
T(1)=291.15;
for i=1:N-1;
T(i+1)=T(i)+10;
end
%Algebric Operations and simplifications
for i=1:N;
%addition Process
a(i)=T0(i)+C(i);
b(i)=T(i)+C(i);
%division Process
c(i)=a(i)/b(i);
d(i)=(T(i)/T0(i))^(1.5);
end
%output section
for i=1:N;
myu(i)=myu0(i)*c(i)*d(i);
end
%storing the produced data into a 2D matrix
for i=1:2;
for j=1:N;
if (i==1)
e(i,j)=T(i);
elseif (i==2)
e(i,j)=myu(i);
end
end
end
display('Temeprature Table')
T'
display('viscosity Table')
myu'
display('Table');
e'
plot(myu,T,'r');
grid on
figure(1)
xlabel('myu')
ylabel('T')
Title('Viscosity vs Temperature')
Example Burning Velocity for Methane/Air Combustion
clc
clear
%Burning Velocity for Methane/air combustion
alphap=-0.504;
alphaT=2.105;
%choosing the number of points
N=10;
DT=400-300;
DP=10/1;
dt=DT/N;
dp=DP/N;
T(1)=300;
P(1)=1;
for i=1:N;
%Data Range Generation
T(i+1)=T(i)+dt;
P(i+1)=P(i)+dp;
%Constant Value Cells
P0(i)=1;
SL0(i)=0.259;
T1(i)=300;
%formula algebric simplification
a(i)=P(i)/P0(i);
b(i)=T(i)/T1(i);
aa(i)=(a(i))^alphap;
bb(i)=(b(i))^alphaT;
%Putting the formula togather
SL(i)=SL0(i)*aa(i)*bb(i);
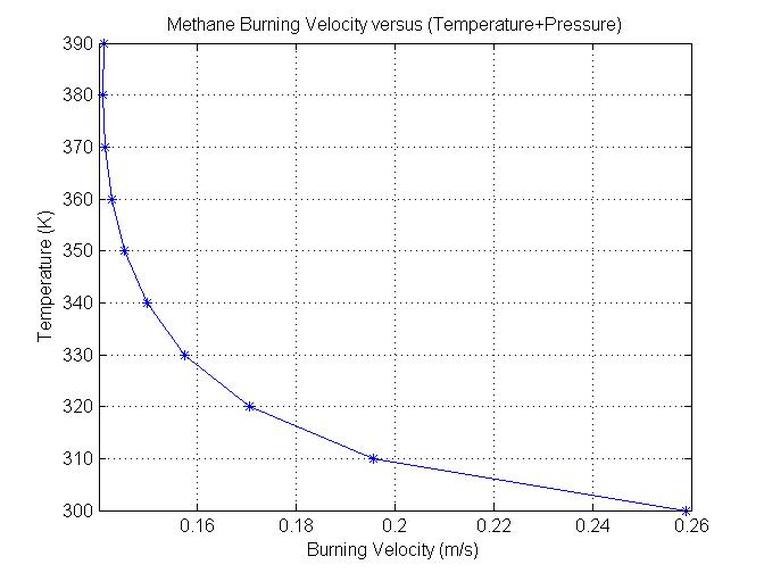
end plot(SL,T(1:N),'-*')
grid on
xlabel('Burning Velocity (m/s)')
ylabel('Temperature (K)')
title('Methane Burning Velocity versus (Temperature+Pressure)')
Example Plotting Specific Heat Capacity of Methane at Constant Pressure
clc
clear
M=1000;
tMIN=-15.1500;
tMAX=900;
TMIN=273+tMIN;
TMAX=273+tMAX;
dt=(TMAX-TMIN)/M;
A1=-0.29149;
A2=26.327;
A3=-10.610;
A4=1.5656
A5=0.16573;
A6=-18.33;
Dt(1)=TMIN;
for i=1:M+1;
Dt(i+1)=Dt(i)+dt;
TH(i)=Dt(i+1)/1000;
CP(i)=4.184*(A1+A2*TH(i)+A3*(TH(i))^2+A4*(TH(i))^3+A5*(TH(i))^-2)/16;
end
T=(TMIN:dt:TMAX);
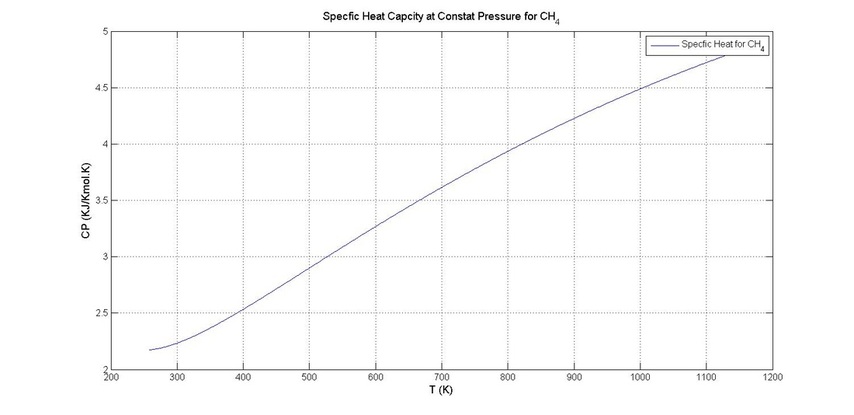
figure('Position',[5 5 1500 730])
plot(T,CP,'-')
grid on
xlabel('T (K)','FontSize',12)
ylabel('CP (KJ/Kmol.K)','FontSize',12)
legend('Specfic Heat for CH_4')
title('Specfic Heat Capcity at Constat Pressure for CH_4','FontSize',12)
Unless otherwise noted, all content on this site is @Copyright by Ahmed Al Makky 2012-2013 - http://cfd2012.com
