Data Visualization using Microsoft Excel
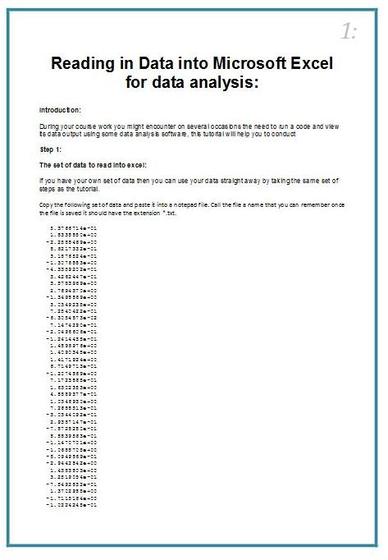
The use of excel can provide an excellent tool for data output visualization, this tutorial is straight forward. This is a simplified tutorial on how to read in data into excel and then visualize it, it is a turbulence example for velocity fluctuations plotted on an xy plane.
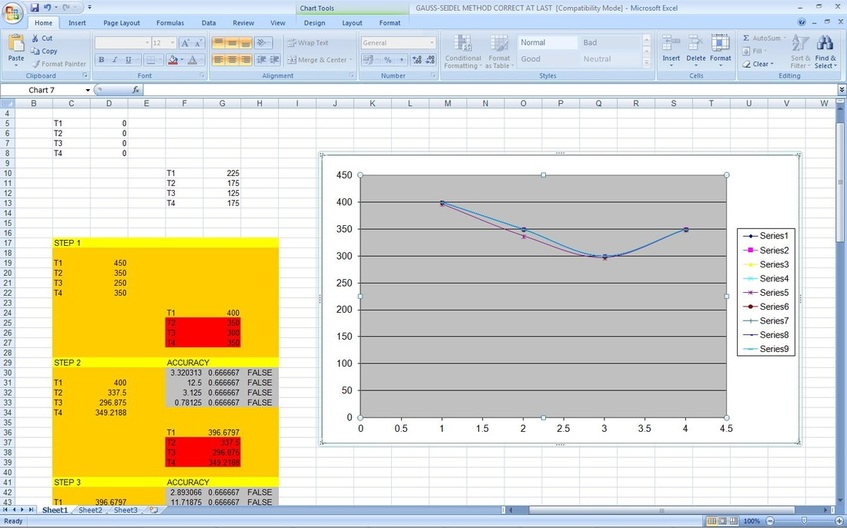
Gauss-Seidel Method in Excel
The user can download it by pressing on the image bellow.
Curve Fitting in Excel
The following link is good
http://www.whitman.edu/geology/winter/Excel.pdf
http://www.eusprig.org/hdykysir.pdf
http://www.whitman.edu/geology/winter/Excel.pdf
http://www.eusprig.org/hdykysir.pdf
EXCEL VBA Programing
1-The following link provides a good start:
http://www.gilmet.ir/tools/Excel_VBA_Programming_For_Dummies.pdf
2- Another good link is
http://www.softpanorama.org/Bookshelf/excel.shtml
3- The following link is a PDF file:
http://www.learningace.com/doc/5872114/68f996d7f29566dd4f01375af9914a48/mastering-excel
http://www.gilmet.ir/tools/Excel_VBA_Programming_For_Dummies.pdf
2- Another good link is
http://www.softpanorama.org/Bookshelf/excel.shtml
3- The following link is a PDF file:
http://www.learningace.com/doc/5872114/68f996d7f29566dd4f01375af9914a48/mastering-excel
Interactive
Great link is the next one: http://itp.nyu.edu/~ym349/pc/theartofinteractivedesign.pdf
Spread Sheet Modelling
Good link to start with:
https://www.pearsonschoolsandfecolleges.co.uk/Secondary/ICT/BTEC/BTECLevel2FirstIT/Resources/Additionalmaterialforusers/Unit27SpreadsheetModelling.pdf
http://www.uvm.edu/~rerickso/education/office/chapter4.htm
https://www.pearsonschoolsandfecolleges.co.uk/Secondary/ICT/BTEC/BTECLevel2FirstIT/Resources/Additionalmaterialforusers/Unit27SpreadsheetModelling.pdf
http://www.uvm.edu/~rerickso/education/office/chapter4.htm
Recommended Reading List
Unless otherwise noted, all content on this site is @Copyright by Ahmed Al Makky 2012-2013 - http://cfd2012.com


