Example Coding a Probability Distribustion Function
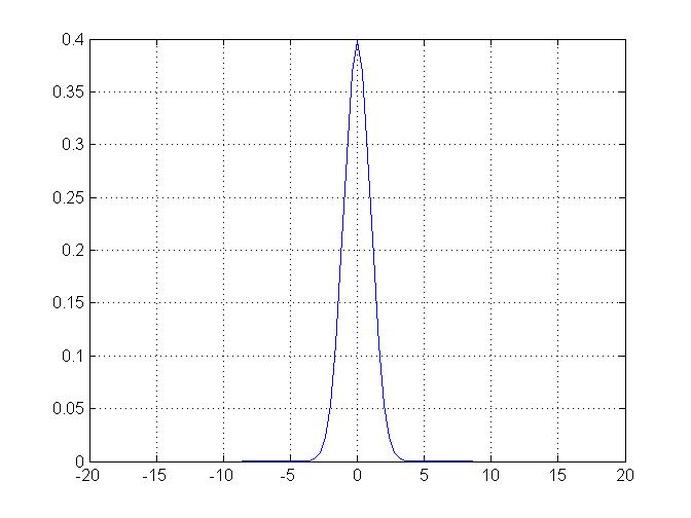
clc
clear
a=(2*pi)^(-0.5)
b=0.5;
x0=-20;
x=20;
M=100;
L=(x-x0)
dx=L/M;
j=x0-dx;
for i=1:M+1
j=j+dx
x(i)=j
y(i)=a*exp(-b*x(i)^2)
end
plot(x,y)
grid on
clear
a=(2*pi)^(-0.5)
b=0.5;
x0=-20;
x=20;
M=100;
L=(x-x0)
dx=L/M;
j=x0-dx;
for i=1:M+1
j=j+dx
x(i)=j
y(i)=a*exp(-b*x(i)^2)
end
plot(x,y)
grid on
Using the Weibull Wind distribution velocity Example
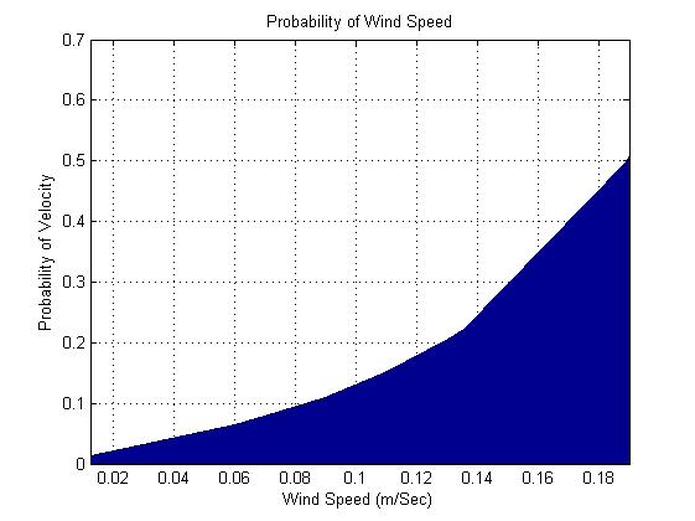
The following code uses the data generated by a random generator the sam code can be used for a real life case for an onsite analysis case.
clc
clear
alpha=2;
N=10;
for i=1:N;
MMM(i)=rand(1,1);
end
Mtot=sum(MMM);
for i=1:N;
MM(i)=MMM(i)/Mtot;
end
M=sort(MM)
grid on
MMAX=max(M)
DM=(M(N)-M(1))/N;
for i=1:N;
PPr(i)=alpha*DM*(M(i)^(alpha-1))*((1/MMAX)^alpha)*exp((M(i)/MMAX)^alpha);
end
Pr=sort(PPr)
area(M,Pr)
title('Probability of Wind Speed')
xlabel('Wind Speed (m/Sec)')
ylabel('Probability of Velocity')
grid on
Example
clc
clear
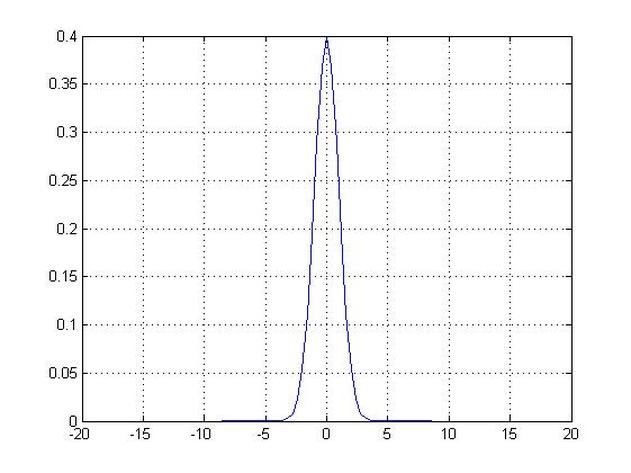
a=(2*pi)^(-0.5);
b=0.5;
x0=-20;
x=20;
M=100;
L=(x-x0)
dx=L/M;
j=x0-dx;
for i=1:M+1
j=j+dx
x(i)=j
y(i)=a*exp(-b*x(i)^2)
end
plot(x,y)
grid on
clear
a=(2*pi)^(-0.5);
b=0.5;
x0=-20;
x=20;
M=100;
L=(x-x0)
dx=L/M;
j=x0-dx;
for i=1:M+1
j=j+dx
x(i)=j
y(i)=a*exp(-b*x(i)^2)
end
plot(x,y)
grid on
Example
clc
clear
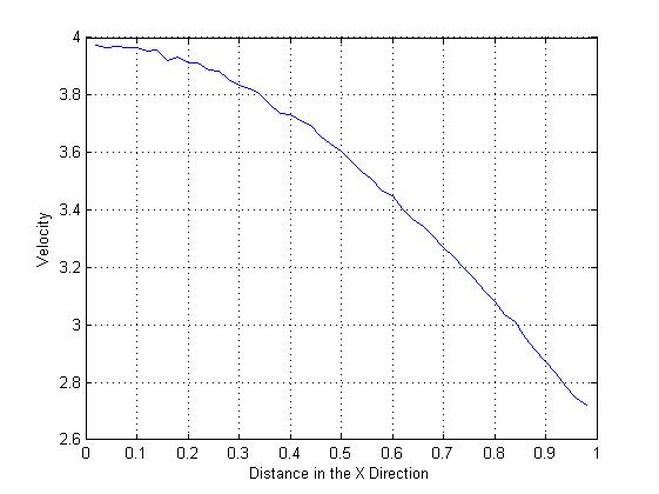
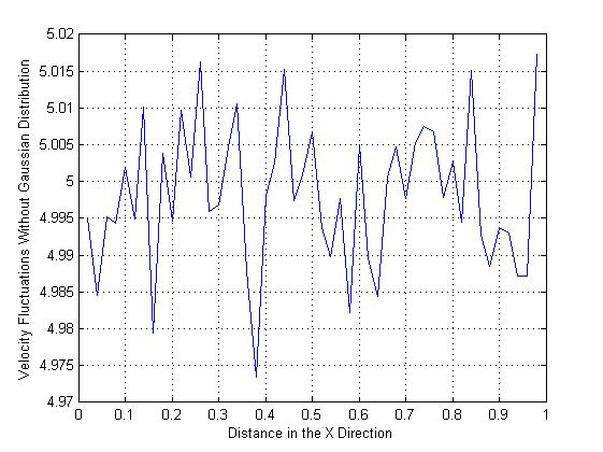
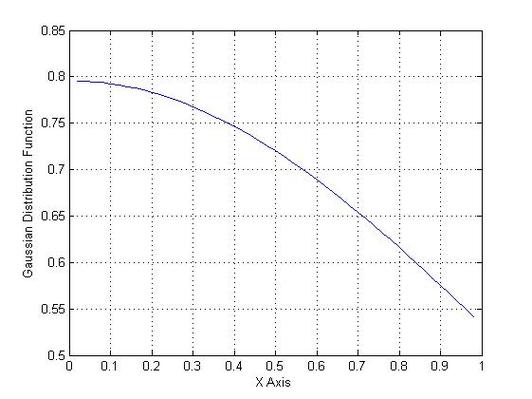
%THIS IS A SAMPLE CODE ON HOW TO USE A GASSIAN DISTRIBUTION FUNCTION %ITS MAINLY USED HERE FOR AND EXAMPLE OF A ONE DIMENSIONAL FLOW WITH %FLUCTUATING VELOCITY AND HIS A DECAY OF A GASSIAN FUNCTION I WISH THE %READER ALL THE BEST GOOD LUCK
SGMA=sqrt(0.2);
MU=0;
A=1/(2*pi*(SGMA)^2);
B=0.5/(SGMA)^2;
L=1; N=50;
DX=L/N;
J=0;%-0.5*N;
for I=1:N-1;
J=J+1;
X(I)=J*DX;
C(I)=(X(I)-MU)^2;
D(I)=-C(I)/B;
F(I)=A*exp(D(I));
end
figure(1)
plot(X,F)
xlabel('X Axis')
ylabel('Gaussian Distribution Function')
grid on
for I=1:N-1;
X(I)=I*DX;
VV(I)=5+0.01*randn(1,1);
V(I)=F(I)*VV(I);
end
figure(2)
plot(X,VV);
xlabel('Distance in the X Direction')
ylabel('Velocity Fluctuations Without Gaussian Distribution')
grid on
figure(3)
plot(X,V);
xlabel('Distance in the X Direction')
ylabel('Velocity')
grid on
Example
clc
clear
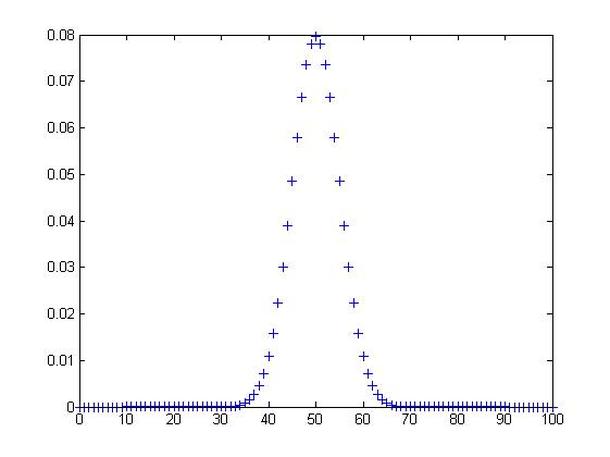
r=betarnd(5,0.2,100,1);
[phat,pci]=betafit(r)
x=[0:1:100];
y=binopdf(x,100,0.5);
plot(x,y,'+')
clear
r=betarnd(5,0.2,100,1);
[phat,pci]=betafit(r)
x=[0:1:100];
y=binopdf(x,100,0.5);
plot(x,y,'+')
Example
clc
clear
a=(2*pi)^(-0.5);
b=0.5
xx0=-10;
xx=10;
L=xx-xx0;
N=40;
dx=L/N;
x=(xx0:dx:xx);
for i=1:N+1;
y(i)=a*exp(-b*(x(i))^2);
end
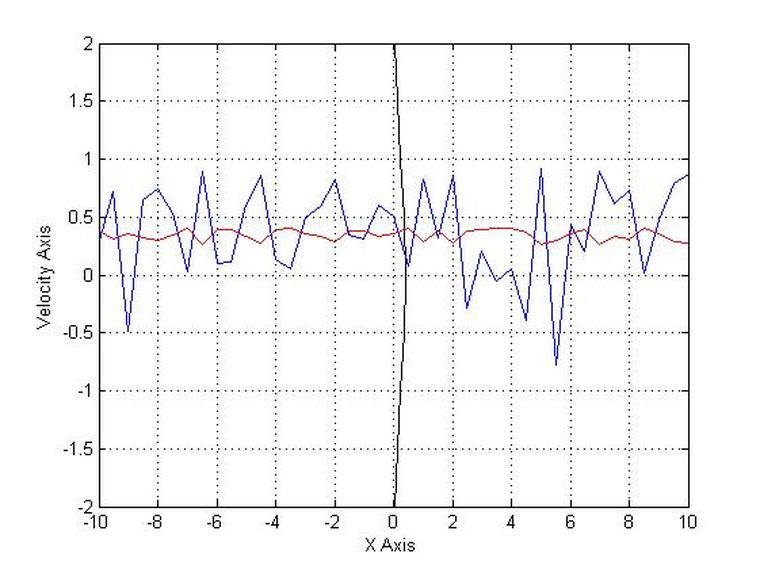
figure(1)
axis equal
plot(y(:),x(:),'k');
xlabel('X Axis')
ylabel('Velocity Axis')
set(gca,'XLim',[xx0 xx],'YLim',[-2 2])
grid on
NU=size(x);
MID=0.5*(NU(2)-1)+NU(1);
for i=1:N+1
mb=randn(1,1);
if mb>1
v(i)=-rand(1,1);
else
v(i)=rand(1,1);
end
end
hold on
plot(x(:),v(:));
for i=1:N+1
V(i)=a*exp(-b*(v(i))^2);
end
plot(x(:),V(:),'r')
grid on
hold off
%Finding the standard deviation direct;y from matlab
s=std(V(:))
%Programing the standard deviation
jh=size(V(:))
mu=sum(V(:))/jh(2)
for i=1:N+1
vl(i)=(V(i)-mu)^2
end
ss=(sum(vl(:))/jh(2))^0.5
%Standard Deviation finished code
%Next finding the Skewness
for i=1:N+1
VVV(i)=(V(i))^3
end
VV=mean(sum(VVV(:)))
skewness(V(:))
SKEWN=VV/(s)^3
%Finding the variance
f=var(V(:))
Unless otherwise noted, all content on this site is @Copyright by Ahmed Al Makky 2012-2013 - http://cfd2012.com
