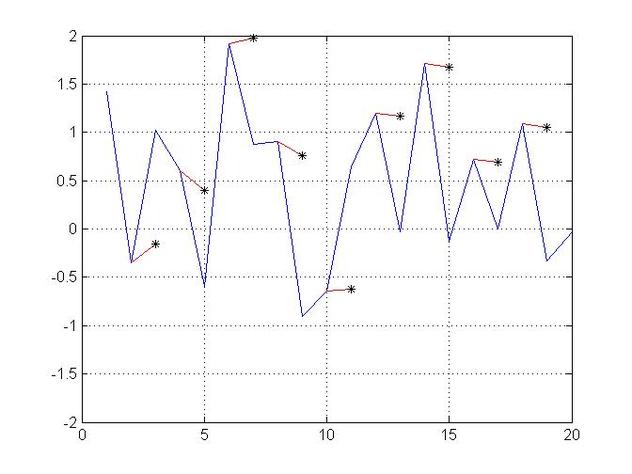
Finding the tangent of a curve at a number of points
clc
clear
N=20;
for i=1:N
x(i)=i;
y(i)=randn(1,1);
end
plot(x,y);
grid on
axis([ 0 N , -2 2 ]);
for i=2:N-1;
m(i+1)=(y(i+1)-y(i))/(x(i+1)-x(i));
m(i-1)=(y(i)-y(i-1))/(x(i)-x(i-1));
m(i)=1;
ff(i)=mean(m);
end
hold on
for i=2:2:N-1;
y(i+1)=ff(i)*(x(i+1)-x(i))+y(i);
a=[ x(i+1) x(i)];
b=[ y(i+1) y(i)];
f=line(a,b,'Color','r');
plot(x(i+1),y(i+1),'*k');
pause(0.1);
end
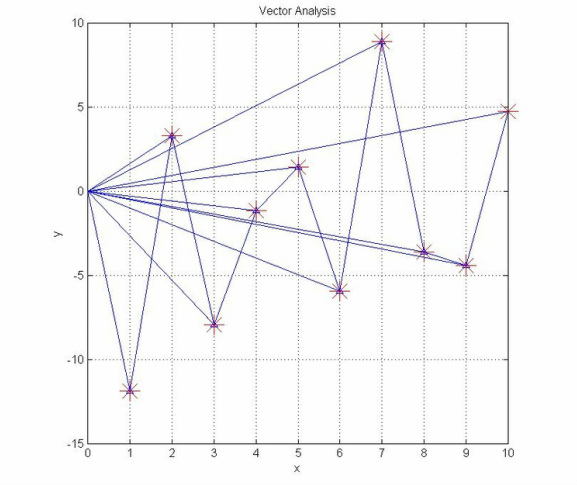
Example Calculating the Traveled Distance by a Point
clc
clear
N=10;
for i=1:N;
x(i)=7*randn(1,1);
end
y=[1:1:N];
plot(y,x)
grid on
hold on
axis square
for i=1:N;
h=plot(y(i),x(i),'*r');
pause(0.1)
set(h,'EraseMode','xor','MarkerSize',18);
end
x0=0;
y0=0;
title('Vector Analysis')
xlabel('x')
ylabel('y')
for i=1:N-1;
v1=[ x0 x(i)];
v2=[ y0 y(i)];
v3=[ x(i+1) x(i)];
v4=[ y(i+1) y(i)];
v5=[ x0 x(i+1)];
v6=[ y0 y(i+1)];
plot(y(i),x(i),'^')
r2=line(v6,v5);
dr=line(v4,v3);
r1=line(v2,v1);
pause(1)
end
%Calculation of Path
x0=0;
y0=0;
x00=0;
y00=0;
for i=1:N;
e=0;
ee=0;
eee=0;
if (i==1)
ee=i;
a(ee)= x(ee)-x0 ;
b(ee)= y(ee)-y0 ;
aa=[a(ee) b(ee)];
c(ee)=norm(aa);
elseif (i>1) & (i<N-1)
e=i;
a(e)=x(e+1)-x(e) ;
b(e)=y(e+1)-y(e) ;
aaa=[a(e) b(e)];
c(e)=norm(aaa);
elseif (i==N)
eee=i;
a(eee)=x(eee)-x0;
b(eee)=y(eee)-y0;
aaaa=[a(eee) b(eee)];
c(eee)=norm(aaaa);
end
end
Traveled_Distance=sum(c)
hold off
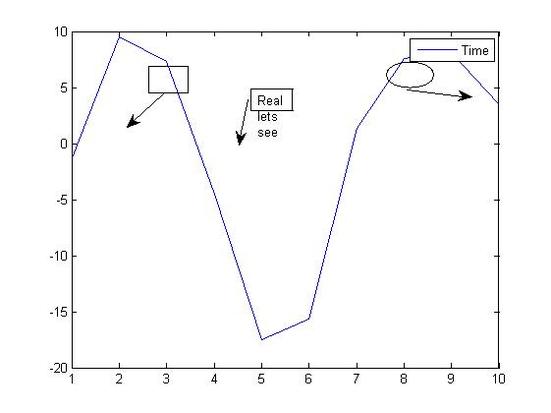
figure(2)
plot(y,x)
hold on
createfigure(y,x)
function createfigure(X1, Y1)
%CREATEFIGURE(X1,Y1)
% X1: vector of x data
% Y1: vector of y data
% Auto-generated by MATLAB on 28-Jun-2011 17:36:12
% Create figure
figure1 = figure;
% Create axes
axes1 = axes('Parent',figure1);
box(axes1,'on');
hold(axes1,'all');
% Create plot
plot(X1,Y1,'Parent',axes1,'DisplayName','Time');
% Create light
light('Parent',axes1,'Style','local','Color',[1 1 0],...
'Position',[-0.821661897846146 34 0.0284632030742599]);
% Create legend
legend(axes1,'show');
% Create arrow
annotation(figure1,'arrow',[0.449305555555556 0.433333333333333],...
[0.758351620947631 0.648379052369077]);
% Create textbox
annotation(figure1,'textbox',...
[0.454472222222222 0.733167082294264 0.0760833333333333 0.0523690773067332],...
'String',{'Real lets see'},...
'FitBoxToText','off');
% Create ellipse
annotation(figure1,'ellipse',...
[0.702083333333333 0.788029925187032 0.0843333333333334 0.0610972568578549]);
% Create arrow
annotation(figure1,'arrow',[0.296527777777778 0.230555555555556],...
[0.772067331670823 0.692019950124688]);
% Create arrow
annotation(figure1,'arrow',[0.738888888888889 0.85625],...
[0.782042394014963 0.764339152119701]);
% Create rectangle
annotation(figure1,'rectangle',...
[0.26975 0.775561097256858 0.0712222222222222 0.064837905236907],...
'FaceColor','flat');
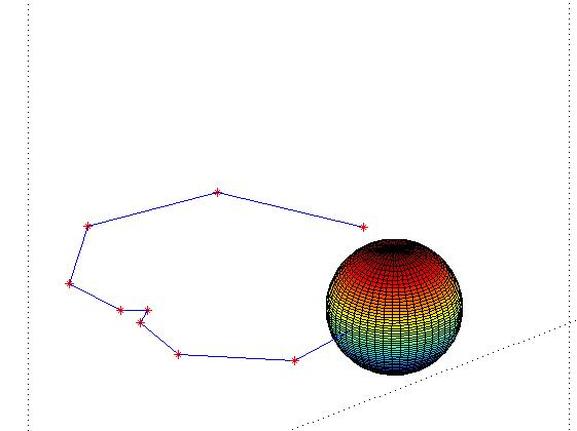
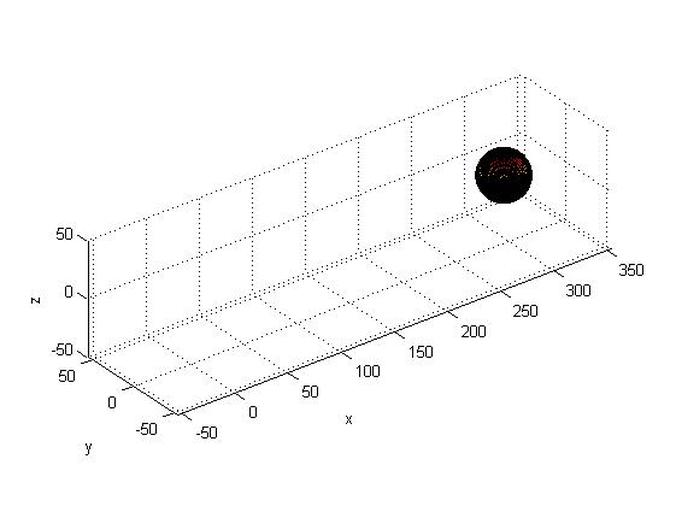
Assigning a Sphere to Specfied Path
clc
clear
rr=1;
L=2*pi*rr;
M=10;
dtheta=L/M;
a=1;
theta(1)=-dtheta;
for i=1:M+1;
theta(i+1)=theta(i)+dtheta;
X0(i)=2*a*(1+cos(theta(i+1)))*cos(theta(i+1));
Y0(i)=2*a*(1+cos(theta(i+1)))*sin(theta(i+1));
end
% plot(x(1:M+1),y(1:M+1))
% axis equal
% title('Cardiod')
% xlabel('x')
% ylabel('y')
% grid on
M=10;
for j=1:M;
% X0(j)=13*j;
% Y0(j)=12*randn(1,1);
Z0(j)=3;
RR=1;
DRR=0;
a=X0(j)
b=Y0(j)
c=Z0(j)
for i=1:M;
A = meshgrid(linspace(0, 2*pi, 51), linspace(0, 2*pi, 51));
X = cos(A);
Y = sin(A);
RR=RR-DRR;
for i=-25:25
R(i+26) = RR*cos(asin(i/25));
end
for i=1:51
for j=1:51
X(j,i) = X(j,i) * R(j);
Y(j,i) = Y(j,i) * R(j);
end
end
Z = meshgrid(linspace(-RR, RR, 51), linspace(-RR, RR, 51))';
surf(X+a, Y+b, Z+c), axis equal, axis([-55 55+a -55 55 -50 50])
xlabel('x')
ylabel('y')
zlabel('z')
pause(0.1)
end
end
hold on
for j=1:M;
plot3(X0(j),Y0(j),Z0(j),'r-*');
hold on
end
for j=1:M-1
aa=[X0(j+1),X0(j)];
bb=[Y0(j+1),Y0(j)];
cc=[Z0(j+1),Z0(j)];
line(aa,bb,cc);
hold on
end
Example
clc
clear
M=50;
for j=1:M;
X0(j)=13*j;
Y0(j)=12*randn(1,1);
Z0(j)=3*randn(1,1);
RR=21;
DRR=0;
a=X0(j)
b=Y0(j)
c=Z0(j)
for i=1:M;
A = meshgrid(linspace(0, 2*pi, 51), linspace(0, 2*pi, 51));
X = cos(A);
Y = sin(A);
RR=RR-DRR;
for i=-25:25
R(i+26) = RR*cos(asin(i/25));
end
for i=1:51
for j=1:51
X(j,i) = X(j,i) * R(j);
Y(j,i) = Y(j,i) * R(j);
end
end
Z = meshgrid(linspace(-RR, RR, 51), linspace(-RR, RR, 51))';
surf(X+a, Y+b, Z+c), axis equal, axis([-55 55+a -55 55 -50 50])
xlabel('x')
ylabel('y')
zlabel('z')
pause(0.1)
end
end
hold on
for j=1:M;
plot3(X0(j),Y0(j),Z0(j),'r-*');
hold on
end
for j=1:M-1
aa=[X0(j+1),X0(j)];
bb=[Y0(j+1),Y0(j)];
cc=[Z0(j+1),Z0(j)];
line(aa,bb,cc);
hold on
end
Unless otherwise noted, all content on this site is @Copyright by Ahmed Al Makky 2012-2013 - http://cfd2012.com
