Lagrangian Length Scale Study
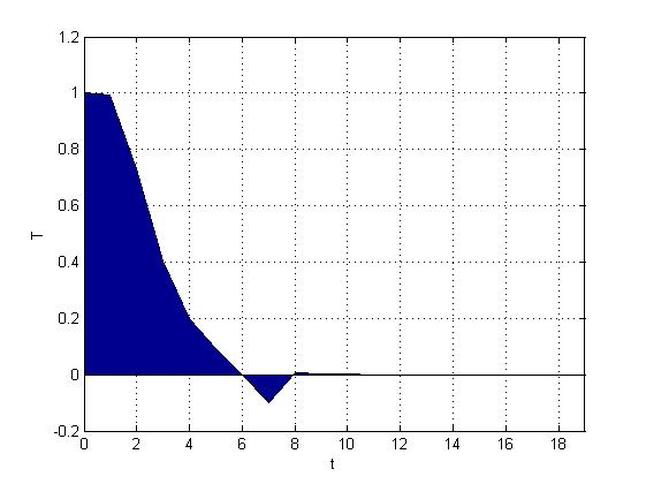
clc
clear
M=20;
c=-1;
for i=1:M;
c=c+1;
t(i)=c;
if (i==1)
T(i)=1;
elseif (i==M | i==7)
T(i)=0;
elseif (i==8)
T(i)=-0.1;
else
T(i)=2.7*t(i)*exp(-t(i));
end
end
area(t,T)
grid on
xlabel('t')
ylabel('T')
T'
for i=1:M;
t1(i)=t(i)-T(i);
end
cc=1;
for i=1:M;
u2(i,1)=rand(1,1);
end
for i=1:M;
u2(i,2)=(T(i)*(u2(i,1))^2)/u2(i,1);
end
figure(2)
plot(t,u2(1:M,1))
xlabel('t')
ylabel('u2(1:M,1)')
grid on
figure(3)
plot(t1,u2(1:M,2))
xlabel('t1')
ylabel('u2(2:M,1)')
grid on
A=mean(u2(1:M,1)');
B=mean(u2(1:M,2)')
TT=(mean(A*B))/(A)^2;
Lagrangian_integral_scale=TT;
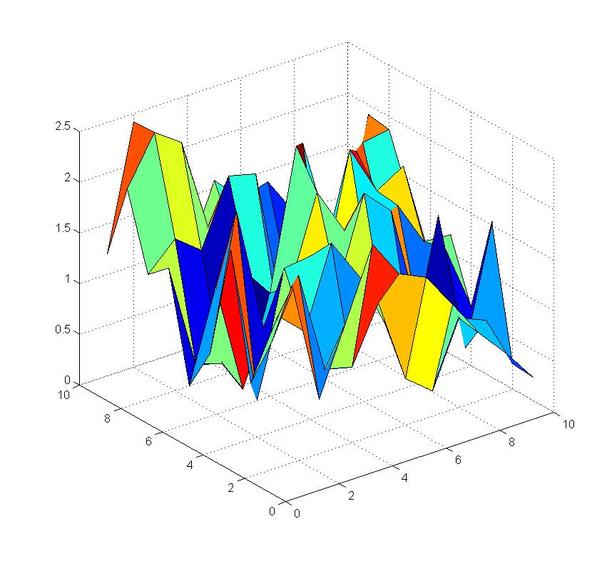
Example Finding the Norm of a Velocity Vector in a 2D Plane Made Up of 10 Points
clc
clear
N=10;
t=(1:1:N);
for s=1:2;
for t=1:2;
for j=1:N;
for i=1:N;
v(i,j,t,s)=randn(1,1);
end
end
end
end
for t=1:2;
for j=1:N;
for i=1:N;
V(i,j,t)=(v(i,j,t,1)^2+v(i,j,t,2)^2)^0.5;
end
end
end
surf(V(:,:,2))
clear
N=10;
t=(1:1:N);
for s=1:2;
for t=1:2;
for j=1:N;
for i=1:N;
v(i,j,t,s)=randn(1,1);
end
end
end
end
for t=1:2;
for j=1:N;
for i=1:N;
V(i,j,t)=(v(i,j,t,1)^2+v(i,j,t,2)^2)^0.5;
end
end
end
surf(V(:,:,2))
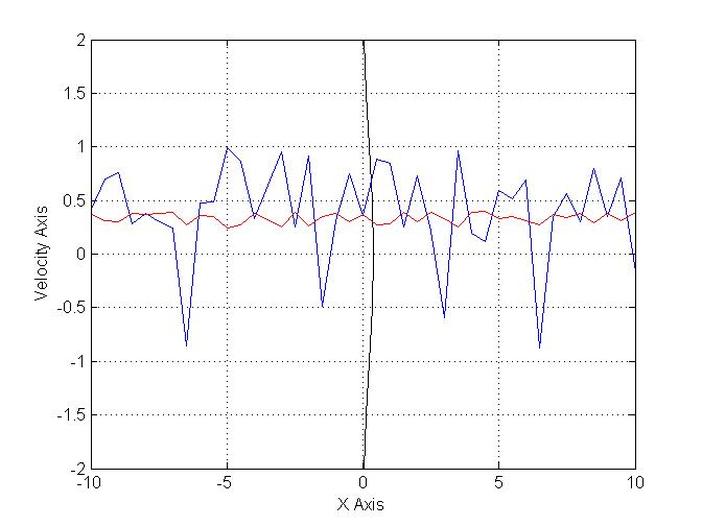
Example A Flucuating Velocity Multiplied by a Probability Distribution Function
clc
clear
a=(2*pi)^(-0.5);
b=0.5
xx0=-10;
xx=10;
L=xx-xx0;
N=40;
dx=L/N;
x=(xx0:dx:xx);
for i=1:N+1;
y(i)=a*exp(-b*(x(i))^2);
end
figure(1)
axis equal
plot(y(:),x(:),'k');
xlabel('X Axis')
ylabel('Velocity Axis')
set(gca,'XLim',[xx0 xx],'YLim',[-2 2])
grid on
NU=size(x);
MID=0.5*(NU(2)-1)+NU(1);
for i=1:N+1
mb=randn(1,1);
if mb>1
v(i)=-rand(1,1);
else
v(i)=rand(1,1);
end
end
hold on
plot(x(:),v(:));
for i=1:N+1
V(i)=a*exp(-b*(v(i))^2);
end
plot(x(:),V(:),'r')
grid on
hold off
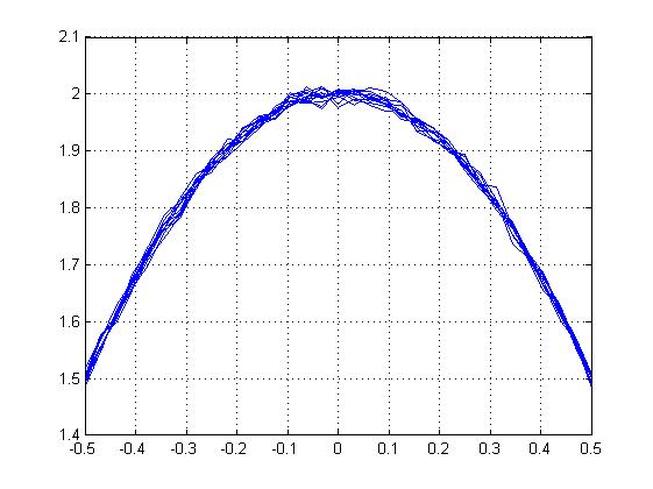
Applying Turbulnce to a Parabolic Profile Using Random Number Generator
clc
clear
for ii=1:12
p=0;
N=16;
umax=2;
for i=-N:N;
p=p+1;
l=1;
dx=l/(2*N);
x(p)=i*dx;
if (p==1)
urms(1)=0;
else if (p==2*N)
urms(2*N)=0;
end
end
urms(p)=0.01*randn(1,1)
uu(p)=umax*(1-(x(p))^2);
u(p)=urms(p)+uu(p);
end
plot(x,u)
grid on
hold on
end
clear
for ii=1:12
p=0;
N=16;
umax=2;
for i=-N:N;
p=p+1;
l=1;
dx=l/(2*N);
x(p)=i*dx;
if (p==1)
urms(1)=0;
else if (p==2*N)
urms(2*N)=0;
end
end
urms(p)=0.01*randn(1,1)
uu(p)=umax*(1-(x(p))^2);
u(p)=urms(p)+uu(p);
end
plot(x,u)
grid on
hold on
end
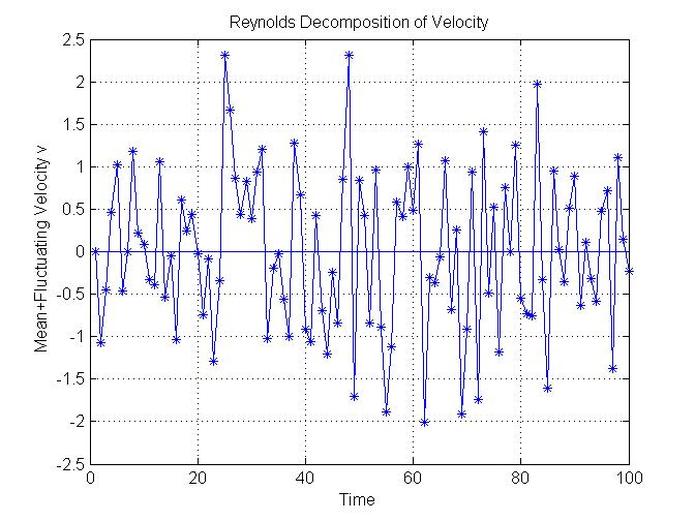
Example Reynolds Decompostion of Velocity
clc
clear
N=100;
t=(1:1:N);
for i=1:N;
v(i)=randn(1,1);
end
V(1:N)=mean(v)
plot(t,v,'-*')
hold on
plot(t,V)
title('Reynolds Decomposition of Velocity')
xlabel('Time')
ylabel('Mean+Fluctuating Velocity v')
grid on
clear
N=100;
t=(1:1:N);
for i=1:N;
v(i)=randn(1,1);
end
V(1:N)=mean(v)
plot(t,v,'-*')
hold on
plot(t,V)
title('Reynolds Decomposition of Velocity')
xlabel('Time')
ylabel('Mean+Fluctuating Velocity v')
grid on
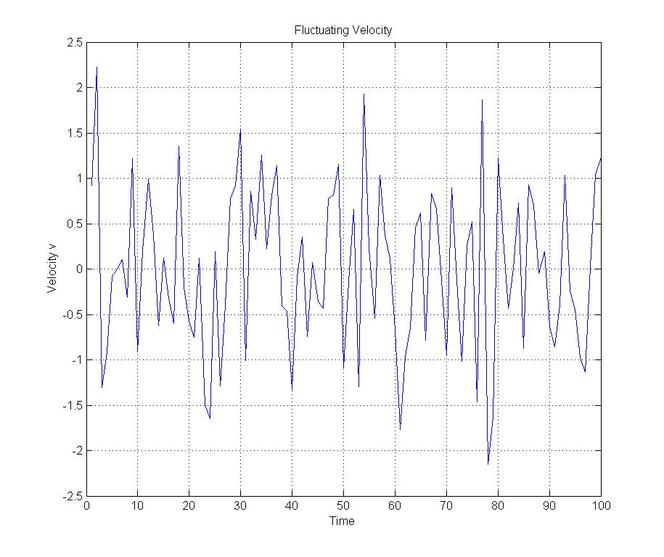
Eample Modelling Flucuating Velocity
clc
clear
N=100;
t=(1:1:N)
for i=1:N;
v(i)=randn(1,1)
end
plot(t,v)
title('Fluctuating Velocity')
xlabel('Time')
ylabel('Velocity v')
grid on
clear
N=100;
t=(1:1:N)
for i=1:N;
v(i)=randn(1,1)
end
plot(t,v)
title('Fluctuating Velocity')
xlabel('Time')
ylabel('Velocity v')
grid on
Flow Statistical Analysis
clc
clear
N=10;
for i=1:N+1
mb=randn(1,1);
if mb>1
V(i)=-rand(1,1);
else
V(i)=rand(1,1);
end
end
%Finding the standard deviation direct;y from matlab
s=std(V(:));
%Programing the standard deviation
jh=size(V(:));
mu=sum(V(:))/jh(1);
for i=1:N+1
vl(i)=(V(i)-mu)^2;
end
ss=(sum(vl(:))/(jh(1)-1))^0.5;
%Standard Deviation finished code
%Next finding the Skewness
for i=1:N+1
VVV(i)=(V(i))^3;
end
VV=mean(sum(VVV(:)));
skewness(V(:));
SKEWN=VV/(s)^3;
%Finding the variance
f=var(V(:));
Unless otherwise noted, all content on this site is @Copyright by Ahmed Al Makky 2012-2013 - http://cfd2012.com
